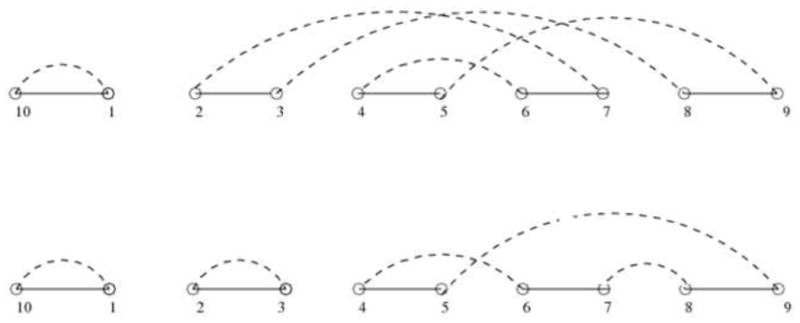
Figure 3.

On the top is the breakpoint graph of genome G = 1, 2,-3, 4,-5, with respect to the identity genome G = 1, 2, 3, 4, 5. We can see there are two cycles in the graph. An optimal DCJ operation removes adjacencies (2,7), (3,8) and creates adjacencies (2,3), (7,8) so that the number of cycles increases by one.
