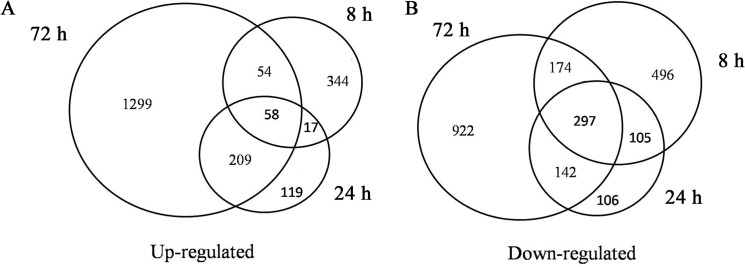
Fig 3. Venn diagrams of sugarcane genes showing changes in the level of transcripts in response to low-K stress.
Venn diagrams of up-regulated (A) and down-regulated (B) genes at different times points after the initiation of low-K treatment. Genes that were up-regulated at at least at one time point (8 h, 24 h and 72 h) were selected for the analysis in (A). Genes that were down-regulated at at least one time point (8 h, 24 h and 72 h) were selected for the analysis in (B).

