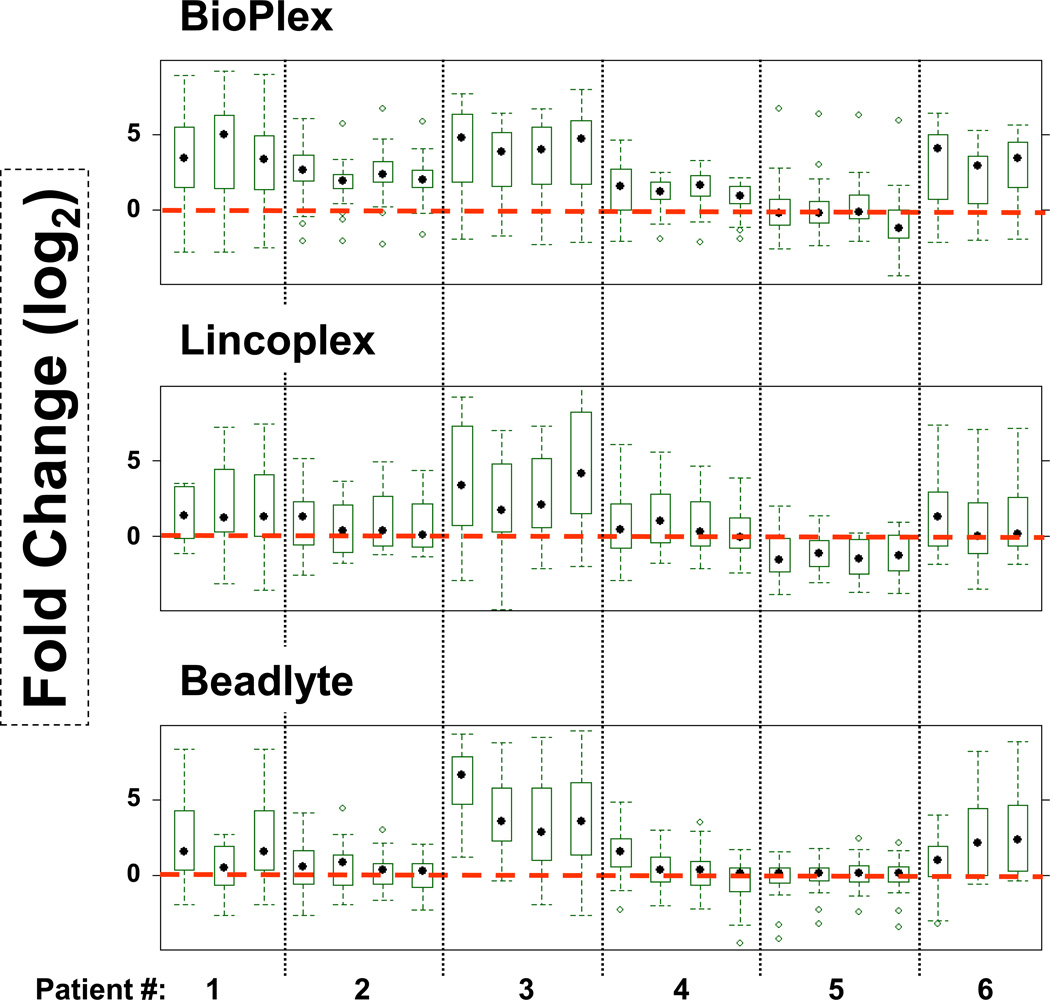
Figure 1.
Fold changes of analytes measured by multiplex kits: The results represent fold differences (Log2 Scale) of all the cytokines collectively between RA patients and healthy individuals (red dotted line; n=14) as measured using each kit. The first data point for each patient is pretreatment and the rest are post-treatment samples (3, 6 and 9 months). Sample (patient) number 1 is missing pretreatment and sample 6 is missing six month time point, respectively.

