
Figure 1.
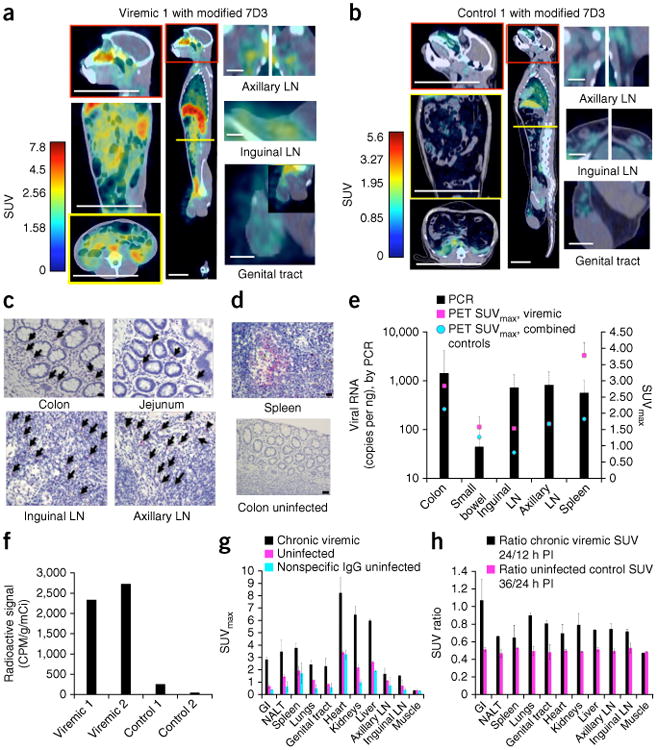
PET/CT results from uninfected control and four chronically SIV infected, viremic rhesus macaques. (a,b) Frontal, sagittal and axial views and magnifications of a viremic monkey, Viremic 1, and of a representative uninfected monkey, Control 1, imaged with the modified 7D3 probe. Sites of axial sections are marked by a yellow line within the sagittal view. Scale bars (white): axial and frontal view of torso and sagittal view of head, 100 mm; sagittal view of whole body, 50 mm; lymph nodes (LN) and genital tract, 20 mm. (c,d) IHC against SIV Gag in tissues from Viremic 1 (c) and in spleen from an SIV-infected monkey with high viremia and in uninfected colon control tissues (d). Arrows indicate infected mononuclear cells. Scale bars: colon uninfected (d), 50 μm; all other images (c,d), 20 μm. (e) Quantification of the PET data from various tissues from 4 SIV-infected and viremic monkeys (magenta) as well as 2 uninfected monkeys administered the 7D3 probe and 2 monkeys administered an isotype IgG probe (blue). The maximum standard uptake value (SUVmax) within each organ was compared directly with the qRT-PCR results. Mean ± s.d. shown for PET and SIV RNA copies for each organ across all animals tested. (f) Rectal biopsy results from 2 chronically infected and 2 uninfected animals. Activity is reported in counts per min (CPM) adjusted for tissue weight and the activity of the injected probe. (g) Comparison of SUVmax results in the same viremic and uninfected monkeys as in e; a repeated measures ANOVA confirmed that the animal conditions were statistically different (P = 7.39 × 10⁻⁶). SUVmax values obtained with nonspecific IgG control in uninfected animals are also included. (h) Measurement of the SUV ratio at two time points following probe injection (PI, post-injection).