
Figure.
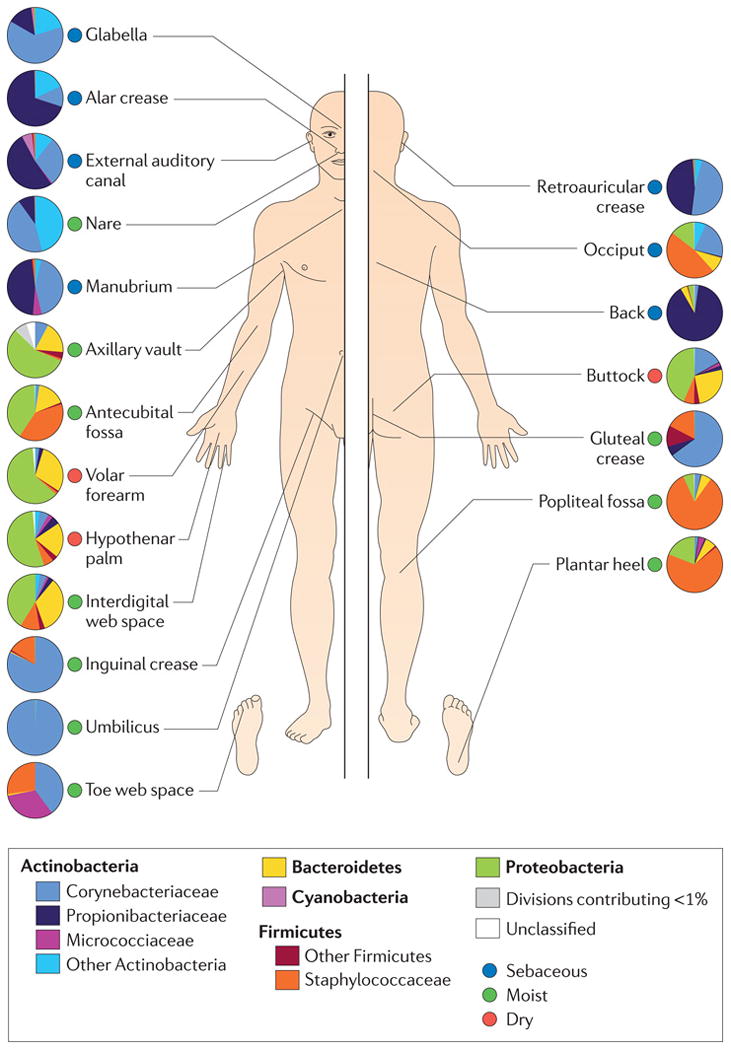
Topographical distribution of cutaneous microbiota and associated microenvironments (dry, sebaceous, moist). Family level classification of bacterial taxa is shown and pie charts represent relative abundance. Figure reproduced with permission of Nature Publishing Group.