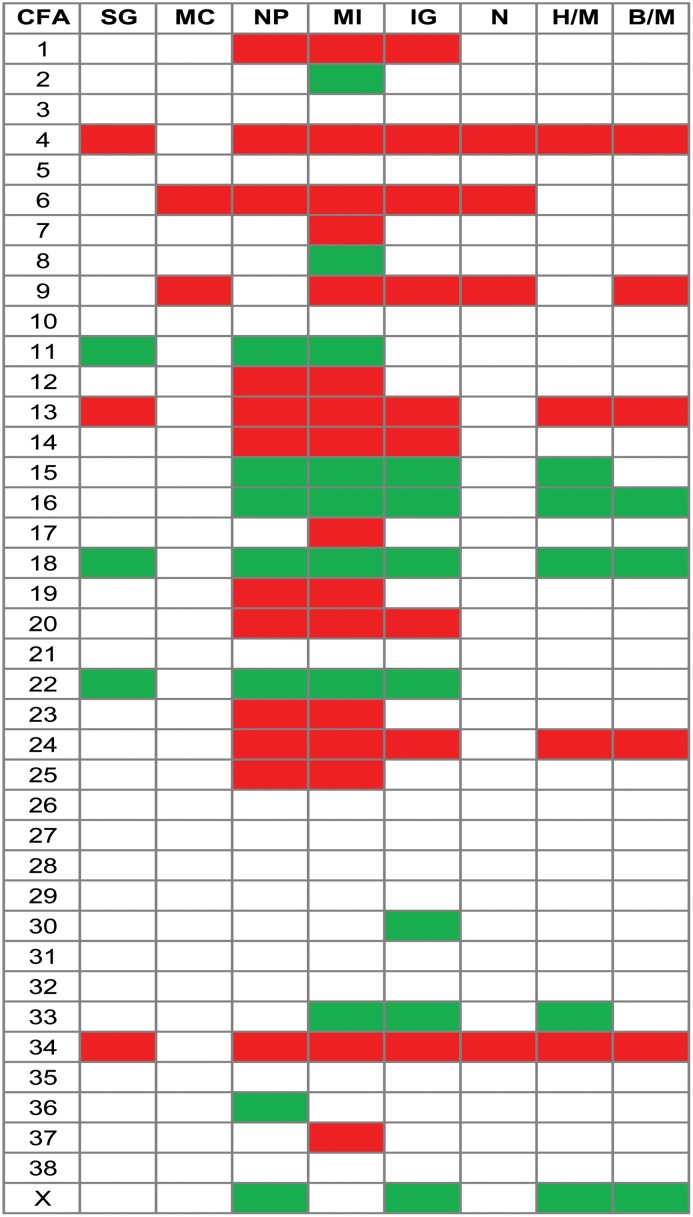
Fig 7. Chromosome-wise gains (red) and losses (green) for different histopathological parameters.
Gain/loss frequencies from the ASCAT analysis were used for these calculations. Only chromosomes with regions with a CNA-frequency difference ≥20% are shown (see Materials and Methods). The corresponding contrasts between hyperplasias/malignant tumours and benign/malignant tumours are shown for comparison. There were no regions with difference in frequency of loss ≥20% for compared categories of the parameters myoepithelial cells and necrosis. CFA: canine chromosome. SG: Solid growth (no/yes), MC: Myoepithelial cells (yes/no), NP: Nuclear pleomorphism (no/moderate-severe), MI: Mitotic index (0/above 9 pr HBF), IG: Invasive growth, tumour stroma (no/yes), N: Necrosis (no/yes), H/M: Hyperplasia vs malignant, B/M: Benign vs malignant.

