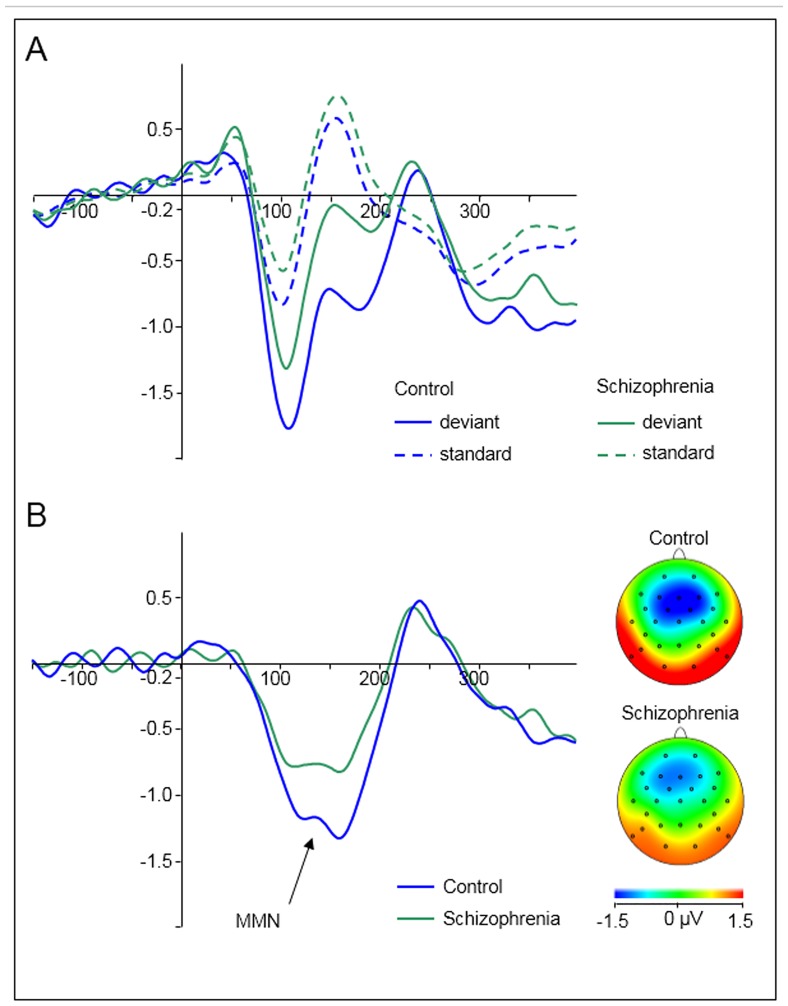
Fig 1. Grand averaged auditory evoked responses of healthy controls (blue) and schizophrenia patients (green) pooled across electrodes Fz and Cz.
Stimulus onset at 0 ms. (A) Event-related responses to deviant (solid lines) and to standard stimuli (dotted lines) stratified by group. (B) Difference waveforms (deviant minus standard) with a clear mismatch negativity component between 100 and 200 ms. Topographic maps are given for the maximum amplitude of the MMN for both groups.

