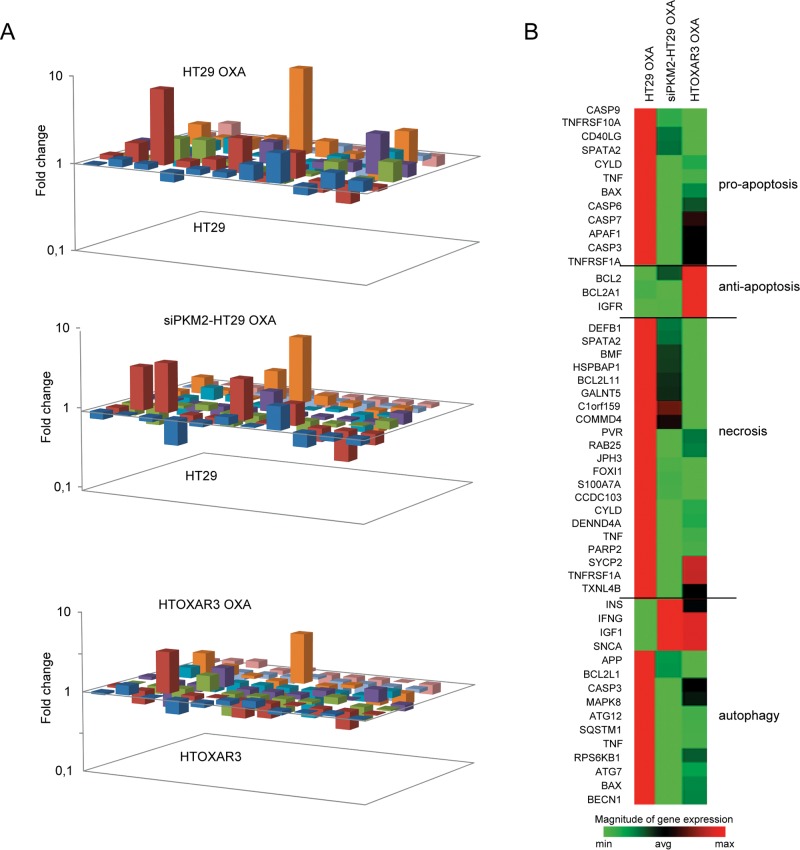
Fig 6. Changes in cell death genes expression patterns after PKM2 gene silencing and/or OXA treatment.
A. 3-D plot showing fold changes in expression patterns after treatment with 10 μM OXA in HT29, siPKM2-HT29 and HTOXAR3 cells. B. Heat map showing up- and down-regulated genes after OXA treatment according to three different cell death pathways.

