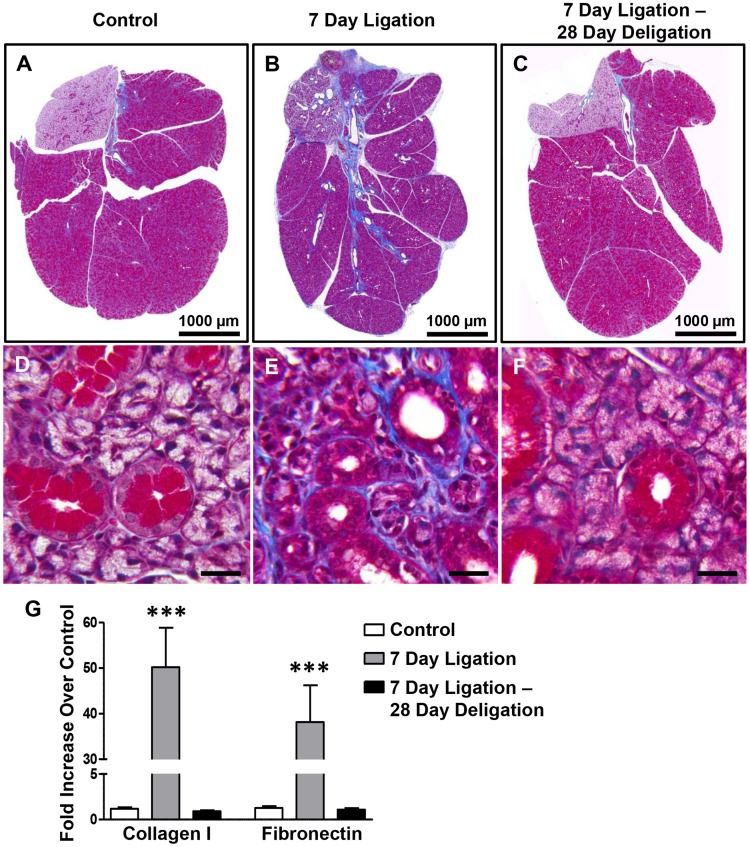
Fig 6. Glandular fibrosis following SMG duct ligation is resolved following deligation.
SMGs from unligated controls (A, D), after a 7 day duct ligation (B, E) or a 7 day ligation followed by deligation and a 28 day recovery (C, F) were subjected to Masson’s trichrome staining to analyze collagen deposition (blue). A 7 day duct ligation resulted in blue staining of collagen fibers around blood vessels and large saliva collecting ducts (B), as compared to controls (A). At 400X magnification, heavy deposition of collagen fibers can be seen in the interstitial area around acinar and ductal cells after a 7 day duct ligation (E), as compared to controls (D). Following ductal deligation and a 28 day recovery (C, F), collagen deposition returns to levels similar to control SMGs (A, D). Images are representative of results from at least 3 independent experiments. (A-C) scale bar = 1,000 μm, (D-F) scale bar = 20 μm. (G) RT-PCR analysis of cDNA prepared from whole SMGs shows extensive upregulation of collagen 1 and fibronectin mRNAs after a 7 day duct ligation (grey bars), which is reversed to control levels (white bars) after deligation and a 28 day recovery (black bars). Data represent means ± S.E.M. (n = 8 for control, n = 7 for 7 day ligation, n = 5 for 7 day ligation, deligation and a 28 day recovery), where ***P<0.001 indicates a significant difference in mRNA expression, as compared to control SMGs.

