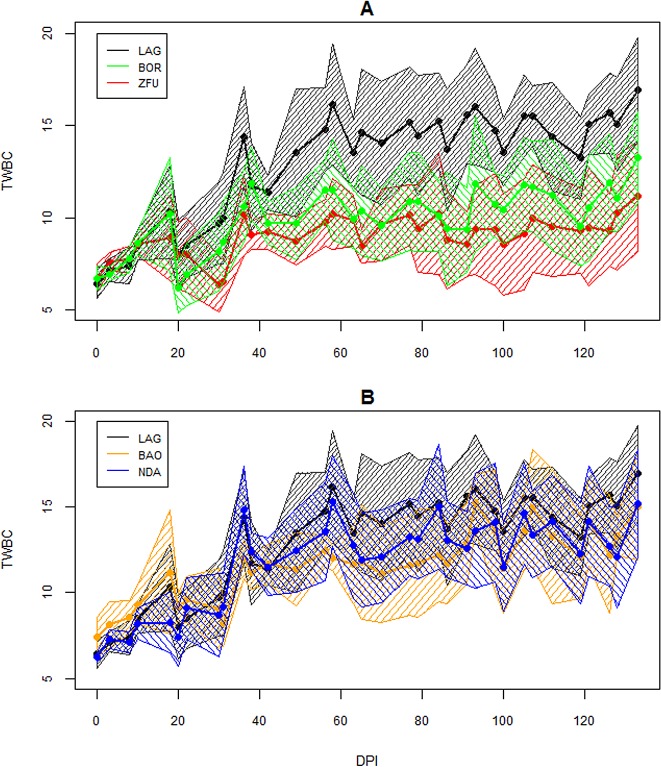
Fig 4. Evolution of TWBC over the time course of infection.
TWBC is expressed as million leukocytes/ml of blood. A. TWBC evolution for the LAG, ZFU and BOR breeds. B. TWBC evolution for the LAG, NDA and BAO breeds. The continuous lines are the average per breed and the surrounding areas represent the confidence intervals of the means at 95%.

