
Fig. 6.
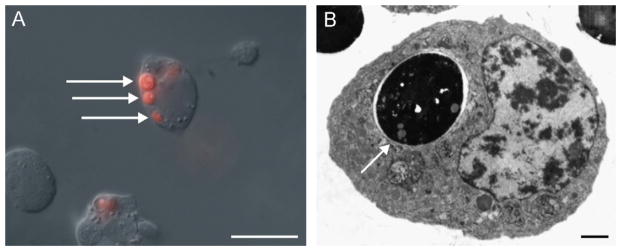
Light and transmission electron microscopy of BME26 cells phagocytosing S. cerevisiae. (A) Merged image of DIC of live cells showing phagocytosed yeast cells pre-stained with cytotracker (arrows). Scale bar = 20 μm. (B) Transmission electron microscopy showing phagocytosed yeast cell within vacuole (arrow). Nu: nucleus. Scale bar = 1 μm.