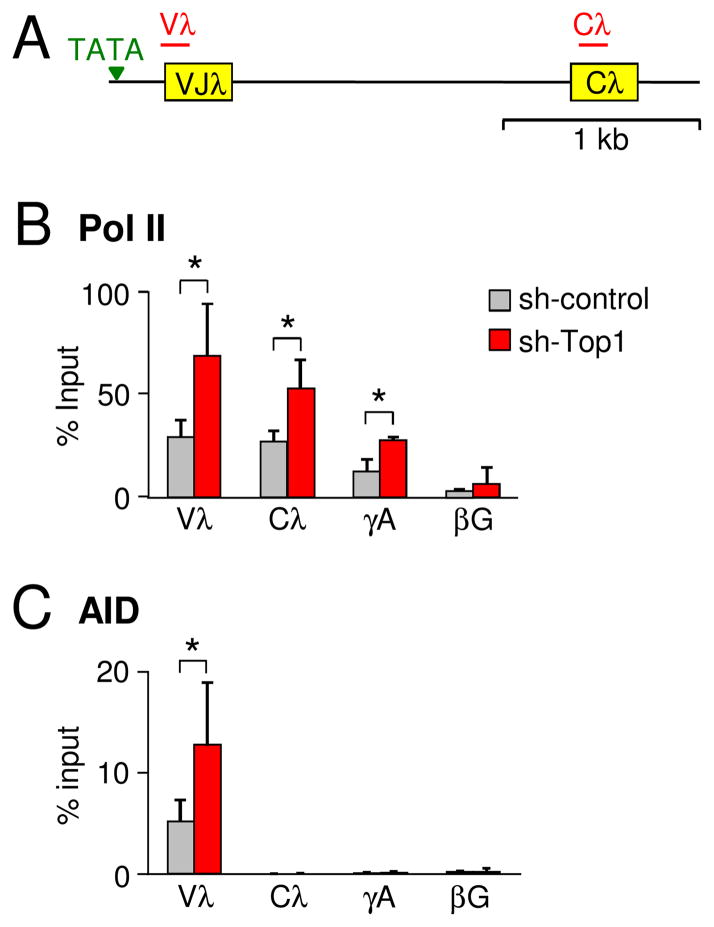
Fig. 2.
ChIP analyses for RNA Pol II and AID. (A) Map of Igλ locus in ΦV− AIDR2 cells. TATA box, green triangle; VJ and C exons, yellow boxes. Red line indicates the area being amplified during ChIP assay. (B) RNA Pol II analysis on 2 subclones from each of 3 sh-control (gray) and 9 sh-Top1 (red) clones; error bars show SD. *, P ≤ 0.05 (unpaired two-tailed Student’s t test). (C) AID analysis on 2 subclones from 3 sh-control (gray) and 9 sh-Top1 (red) clones; error bars depict SD. *, P = 0.02 (unpaired two-tailed Student’s t test).

