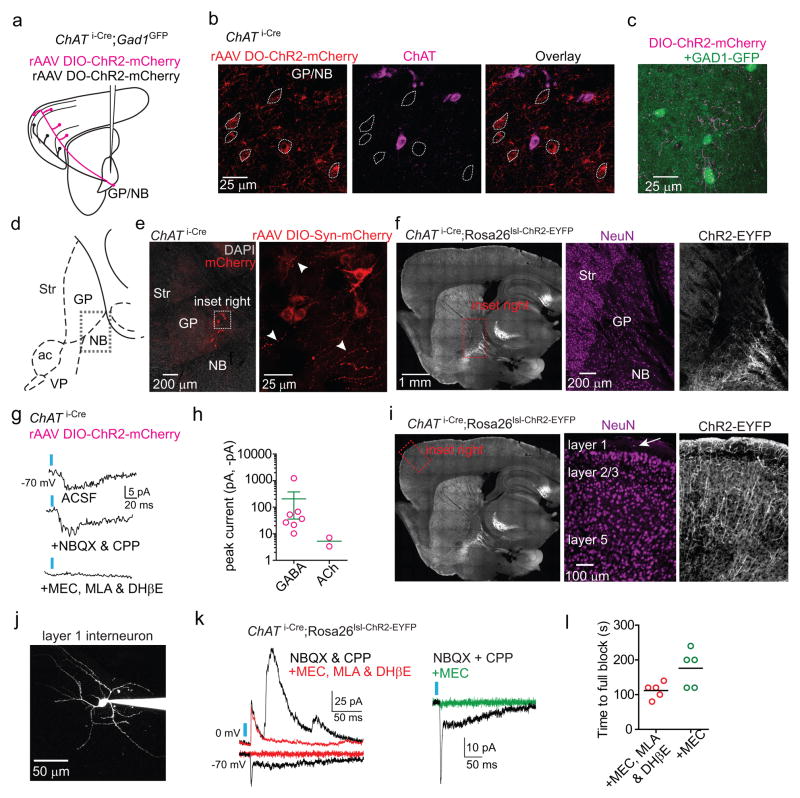
Extended Data Figure 7. ChR2-mediated stimulation of ChAT i-Cre axons following rAAV transduction or with a Cre-activated allele evokes ACh and GABA mediated currents.
a,b. Targeting ChR2 expression to ChAT+ and ChAT− GP-FC cells. a. Schematic of ChAT+ (magenta) or ChAT− (black) GP-FC axons expressing ChR2-mCherry after DIO (Cre-On) or DO (Cre-Off) rAAV transduction in the GP of ChAT i-Cre;GAD1GFP mice. b. rAAV DO-ChR2-mCherry transduced into the ChAT i-Cre GP expresses ChR2-mCherry selectively in Cre− neurons. Single confocal plane showing neighboring ChR2-mCherry+ soma (dotted outline) and ChAT+ soma at the GP/NB border. Of n=158 ChR2-mCherry+ neurons surrounding n=223 ChAT+ neurons, n=0 were ChR2-mCherry+ChAT+ (from 2 mice). c. ChAT+ axons surrounding GAD1GFP expressing cells in FC layer 6. d–f. ChAT+ GP-FC cells ramify local axon collaterals around the GP/NB border. d. Sagittal atlas with the GP/NB border indicated with a dashed box. e. Left, low magnification view of ChAT i-Cre GP following transduction with rAAV DIO-Synaptophysin-mCherry. DAPI (grey), nuclear stain. Right, max projection confocal stack (28 μm) of inset region. Example putative presynaptic boutons indicated by arrowheads. f. Left, low magnification sagittal section from ChAT i-Cre;Rosa26lsl-ChR2-EYFP/+ mouse. Right, high magnification inset of GP showing distribution of neurons (NeuN immunostain, magenta) and ChR2-EYFP+ processes (white). g,h. Following rAAV transduction in ChAT i-Cre mice, ChR2 activation of local ChAT i-Cre axon collaterals results in rare nicotinic EPSCs but prevalent GABAergic IPSCs onto ChR2− GP/NB neurons (EPSC=2 of 85 cells; IPSC=7 of 85 cells from 6 mice). g. Light-evoked EPSC from an example ChR2− GP/NB cell voltage-clamped at −70 mV (top) was insensitive to glutamate receptor block with NBQX and CPP (middle), but abolished by bath application of MEC, MLA & DHβE (bottom), suggesting the EPSC resulted from ACh release and nicotinic receptor activation. h. Summary of peaks from nicotinic EPSCs and GABAergic IPSCs evoked from ChAT i-Cre axons onto ChR2− GP/NB cells. i. Left, low magnification image of sagittal section from a ChAT i-Cre;Rosa26lsl-ChR2-EYFP/+ mouse. Right, high magnification of inset from frontal cortex showing distribution of neurons (NeuN immunostain, magenta) and ChR2-EYFP (white), expressed in axons from basal forebrain and in local cortical interneurons. j. Maximum intensity 2-photon projection of a layer 1 interneuron following whole-cell recording. k. Left, light-evoked current responses from two layer 1 interneurons held at indicated potentials to optogenetic activation in a ChAT i-Cre;Rosa26lsl-ChR2-EYFP/+ mouse in baseline conditions (black, NBQX & CPP) and after bath application of nicotinic receptor antagonist cocktail (red, MEC, MLA & DHβE). Right, nicotinic EPSCs are blocked by bath application of the non-selective blocker MEC alone (green). l. Time until full block of light-evoked nicotinic EPSCs following bath application of either nicotinic receptor antagonist cocktail (MEC, MLA & DhβE, n=5 cells from 3 mice) or MEC alone (n=5 cells from 3 mice). Inter-stimulus interval = 20 s.

