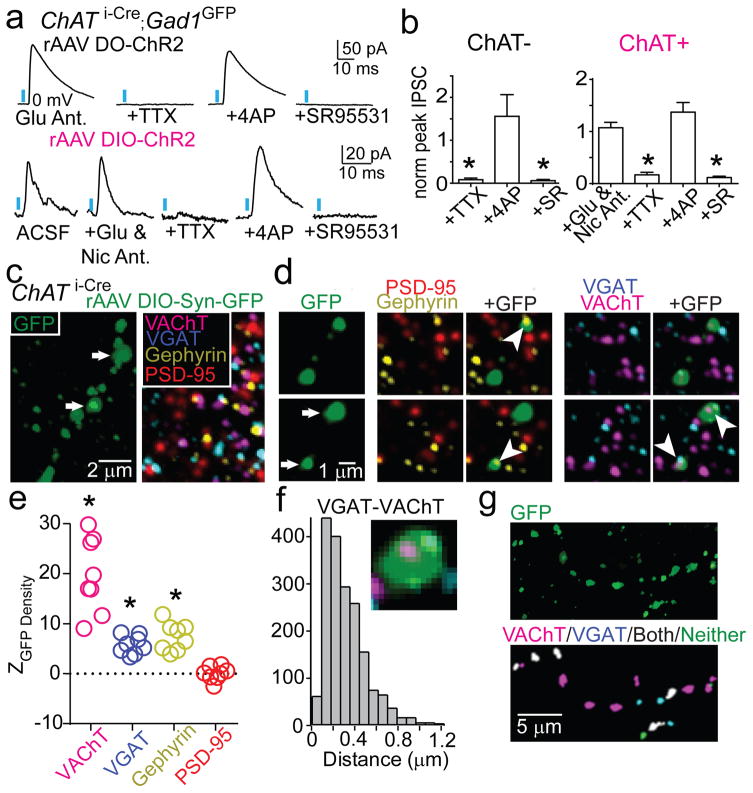
Figure 3. GP-FC cells release GABA and ACh in FC.
a–b. DIO (Cre-On) or DO (Cre-Off) rAAV transduction in the GP of ChAT i-Cre;GAD1GFP mice targets ChR2 to ChAT+ or ChAT− GP neurons.
a. Top, IPSCs in a layer 6 interneuron evoked by optogenetic activation of ChAT− axons under baseline conditions of glutamate receptor antagonism (NBQX and CPP) and following co-application of (from left to right) voltage-gated sodium channel blocker TTX, voltage-gated K+ channel blocker 4-aminopyridine (4AP) and the GABAA receptor antagonist SR95531. Bottom, IPSCs in a ChR2− neuron at the GP/NB border following optogenetic activation of surrounding ChAT+ cells under baseline conditions (ACSF) and following co-application of glutamate (NBQX & CPP) and nicotinic (MEC, MLA & DHβE) receptor antagonists, TTX, 4AP and SR95531.
b. IPSC peaks across conditions normalized to baseline (ChAT−, n=5 cortical interneurons; ChAT+, n=7 ChR2− GP/NB cells). c–g. Co-localization analysis of virally labeled ChAT+ pre-synaptic axon terminals (PSTs) in FC using array tomography. c. Left, maximum projection (z=2.17 μm) through layer 1 of FC showing GFP+ axon following injection of rAAV DIO-Synaptophysin-GFP into the GP of a ChAT i-Cre mouse. Right, a single plane of immunohistochemical labeling. d. Consecutive z-planes illustrating synaptic marker association with GFP+ PSTs (arrows in c). PSTs abut Gephyrin but not PSD-95 and contain both VGAT and VAChT punctae (arrowheads). e. Z scores for mean marker densities within GFP+ PSTs for real vs. PST-randomized data (n=8 stacks), indicating higher densities in the real data. Asterisk, P<0.001 for all stacks. f. Centroid separation of VGAT and VAChT punctae within the same GFP+ PST (n=1,851 comparisons).
g. Left, maximum projection of GFP+ axon in layer 1. Right, GFP+ PSTs color-coded by VGAT/VAChT identity.

