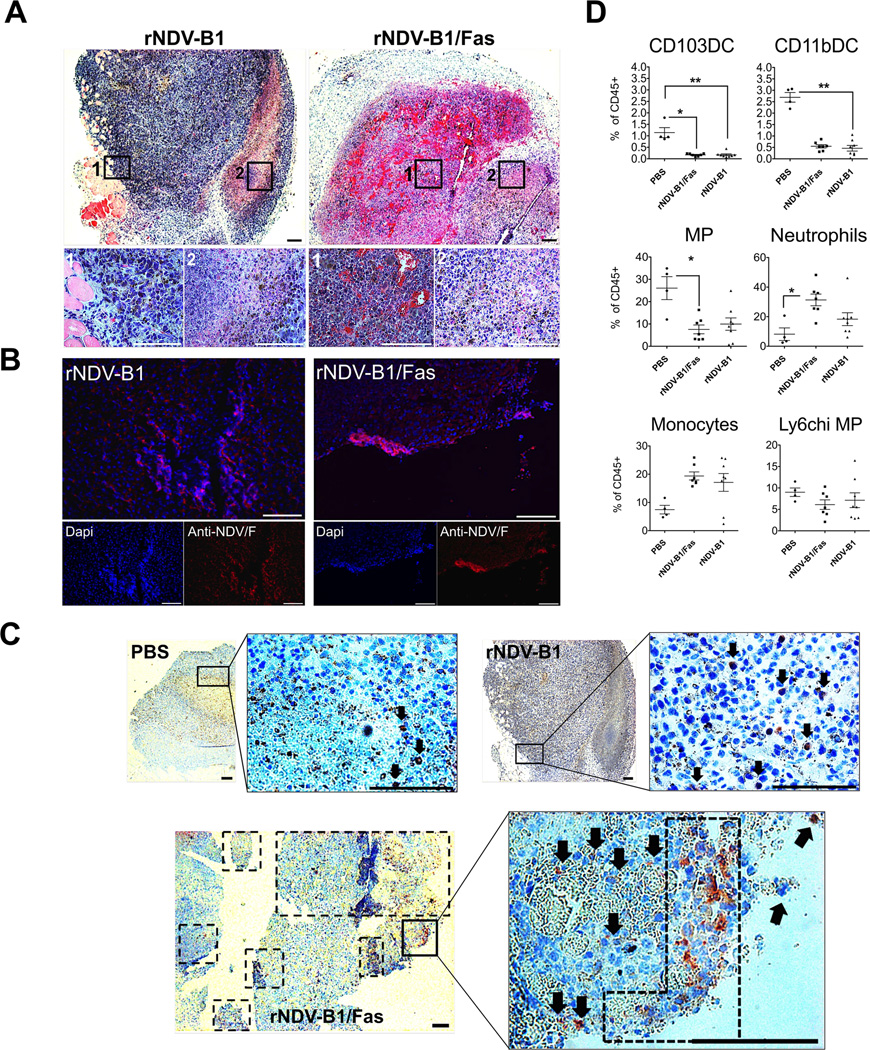
Figure 5. rNDV-B1/Fas intratumoral treatment leads to earlier and enhanced apoptotic response and differential immune infiltration in vivo.
A, histopathology. Hematoxylin and eosin staining of 5 µm-thick sections from rNDV-B1 or rNDV-B1/Fas treated tumors. White squares note magnified areas corresponding with 1 and 2 lower panels. Black scale bar: 200 µm. White scale bar: 100 µm. B, virus immunodetection. Microscopy images of tumor treated samples showing virus infection 24 hours after intratumoral administration. 5 µm-thick sections from rNDV-B1 or rNDV-B1/Fas treated tumors were stained with monoclonal anti-NDV F protein (red) and Dapi (blue) for nuclear contrast. White square note magnified area. White scale bar: 100 µm. C, apoptosis detection in fixed tumor samples. Active caspase 3 immunodetection in tumor-treated samples 24 hours post-injection. 5 µm-thick sections from PBS, rNDV-B1 or rNDV-B1/Fas tumor-treated samples were stained with polyclonal anti-active caspase 3 protein (red) and hematoxilin (blue) for counterstaining. Black squares note magnified areas. Black arrows and dot square note caspase 3 positive cells. Scale bar 200 µm. D. Analysis of myeloid populations within the tumor microenvironment. B16-F10 cells were implanted in the flank of the posterior right leg of C57BL/6 mice. Starting on day ten after tumor cell line injection, the animals were intratumorally treated every 24 hours with a total of three doses of 5×10⁶ PFU of rNDV-B1/Fas, rNDV-B1 or PBS for control mice. 24 hours after the last dose, the tumors were removed and specifically processed for the isolation and analysis by Flow cytometry of the different myeloid cells lineages. Values for each of the populations were expressed as a percentage respect to the total CD45 positive cells isolated from each tumor (*p< 0.05, **p, 0.005).

