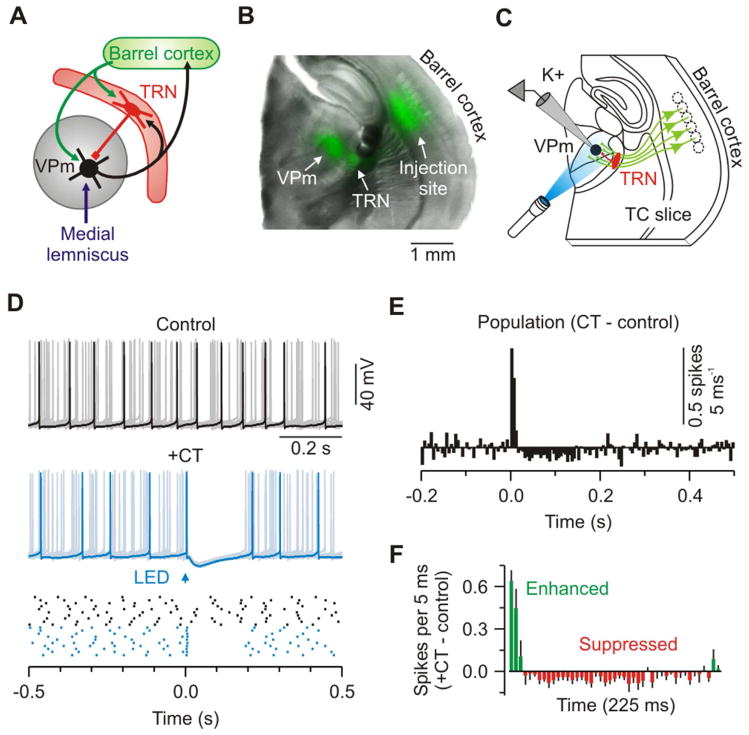
Figure 1. Low frequency CT stimuli modulate VPm excitability.
(A) Schematic of the principal pathway for whisker-related sensory processing in rodent forebrain.
(B) Image of a live TC slice (300 μm) from an Ntsr1-Cre mouse injected in barrel cortex with an AAV driving Cre-dependent ChR2-EYFP expression in L6 CT cells; Overlay of EYFP (green) and bright-field (gray). See also Figure S1.
(C) Schematic of recording configuration: Optical stimulation of ChR2-expressing CT axons (green) and whole-cell recording (K+ solution) from a ChR2-negative VPm cell (black).
(D) Top, control activity from a VPm neuron during injection of depolarizing current (overlay of 10 sweeps); middle, same cell and conditions except addition of CT stimulation (arrow, 1 ms flash; trials repeated at 0.1 Hz); bottom, raster plot of cell’s spiking. Control (black) and +CT (blue) trials are plotted as clustered groups for displays, but were interleaved during testing.
(E) Population peri-stimulus time histogram (PSTH: 5 ms bins) plotting difference in spike rates for CT versus control trials (n = 9 cells from 5 mice).
(F) Population PSTH showing the first 225 ms after CT stimulation. For (D–F), cells were injected with 30–110 pA to produce ~12 Hz baseline firing rates. CT stimulus intensities were 2x threshold for IPSPs (mean = 3.02 mW). See also Figure S2.

