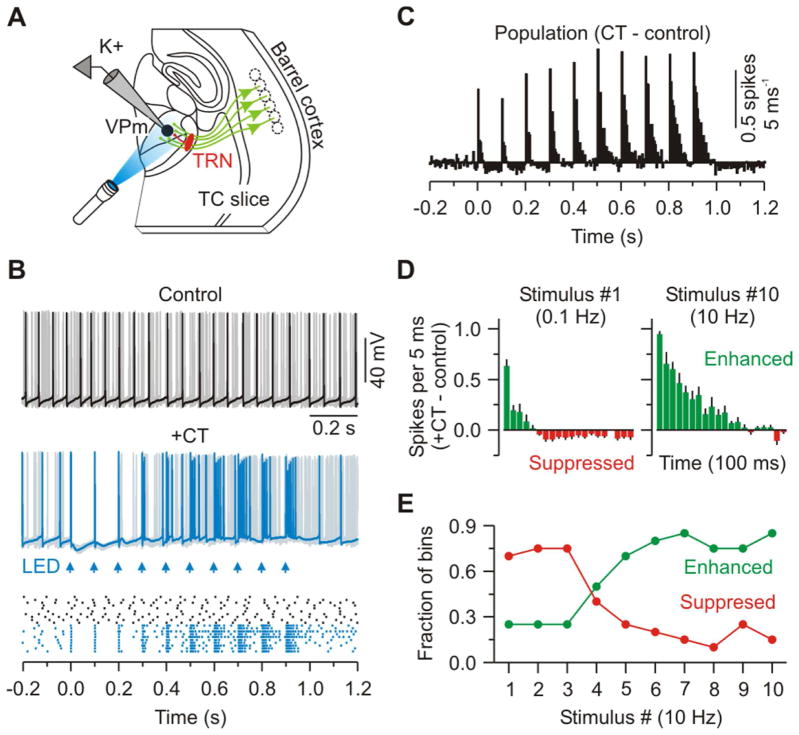
Figure 2. Trains of optical CT stimuli initially suppress and later enhance VPm excitability.
(A) Schematic of recording configuration.
(B) Same conditions as Figure 1D except repetitive CT activation (10 Hz - arrows); notice transition of CT effect from suppression to enhancement of spiking across the train.
(C) Population PSTH (5 ms bins) plotting difference in spike rates for CT versus control trials (n = 12 cells from 6 mice).
(D) Population PSTH showing the initial 100 ms of response after the first and tenth CT stimuli. Data are represented as mean ± SEM.
(E) Fraction of bins in which the spike rates were suppressed (red) or enhanced (green) by CT stimulation versus stimulus number (bin counts taken from the population plot shown in (C)).

