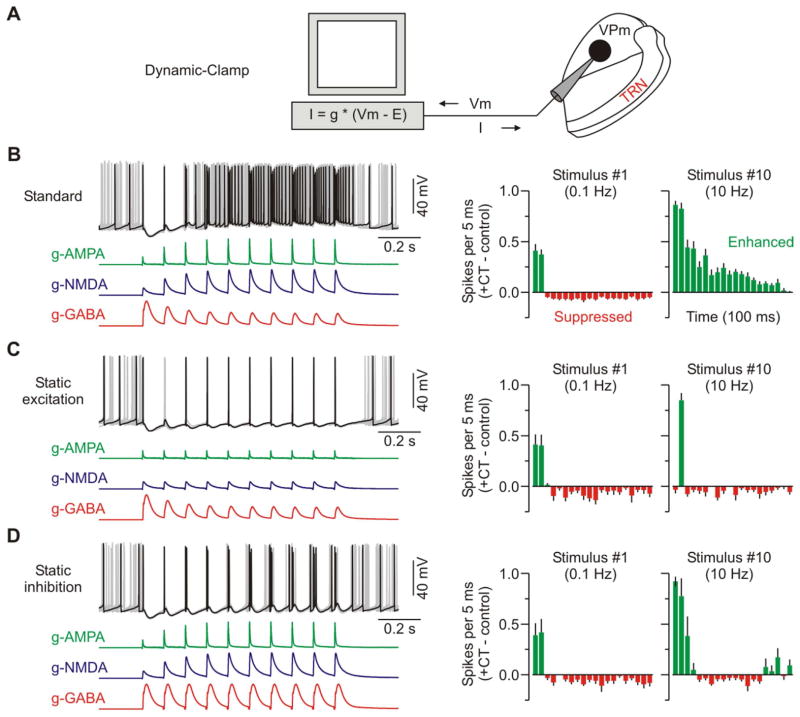
Figure 5. Synaptic dynamics can account for frequency-dependent switching in CT-triggered modulation of VPm excitability.
(A) Same recording configuration as described in Figure 4E.
(B) Different example cell but the same excitability experiment as described in Figure 4F. Left, overlay of 10 sweeps in which dynamic-clamp was used to model the three standard CT-evoked conductances. Right, population PSTHs (5 ms bins) plotting difference in spike rates (i.e., trials with CT conductances versus control trials) for the first and tenth CT stimuli (n = 14 cells from 6 mice).
(C) Similar excitability experiment for the cell shown in B, but short-term facilitation of the excitatory conductances (g-AMPA and g-NMDA) was removed by statically repeating the first conductances across the train (n = 6 cells from 4 mice).
(D) Similar excitability experiment for the cell shown in B, but short-term depression of the inhibitory conductance (g-GABA) was removed, again by repeating the first conductance across the train (n = 7 cells from 4 mice). Data are represented as mean ± SEM.

