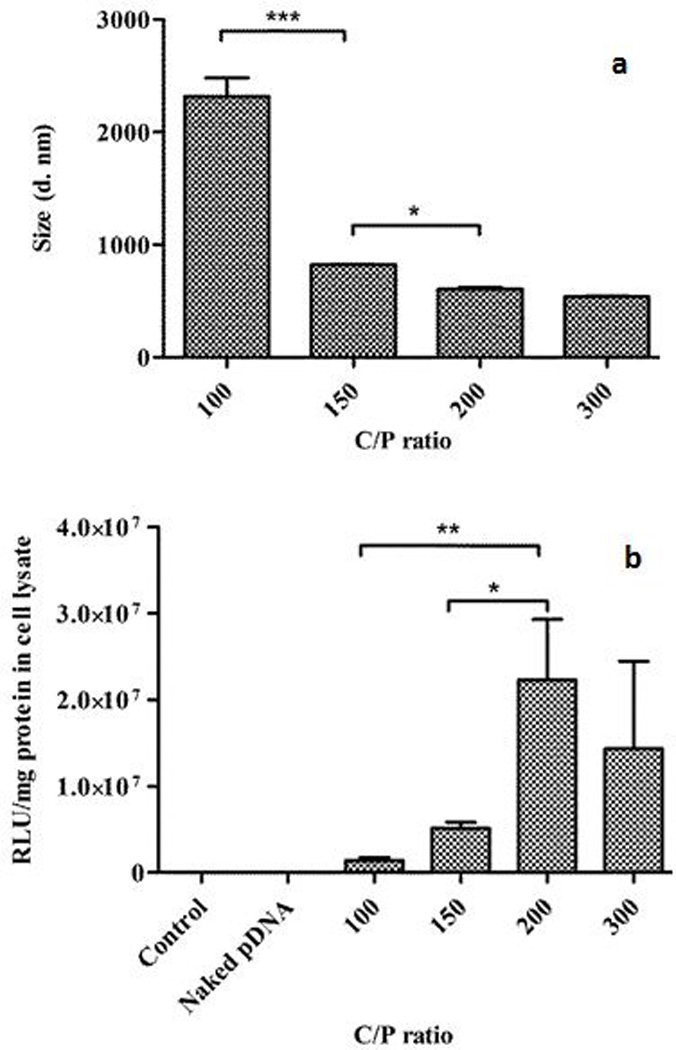
Figure 1.

Effect of different Ca/P ratios on size of calcium phosphate-pDNA (LUC) complexes; Inset: Table displaying average size of the complexes (with standard deviation) corresponding to different Ca/P ratios (a) and transfection efficiency of calcium phosphate-pDNA (LUC) complexes in HEPM cells at 4 h of incubation time (b) (*p < 0.05; **p < 0.01; ***p < 0.001)
