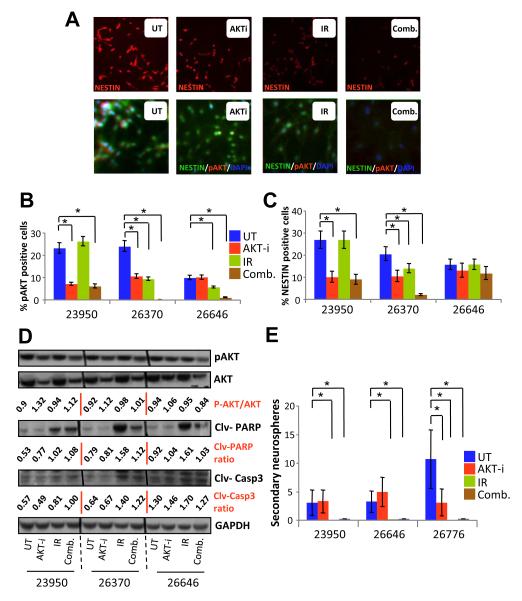
Figure 4.
Expression markers and neurosphere responses of minimal-dose AKT-i in primary GBM cells. (A) Representative images of cells plated on chamber slides were treated every day for 5 days with AKT-i and radiation; 48 hours later, cells were fixed and stained for NESTIN, p-AKT and DAPI for nuclear staining. (B) Quantitation of p-AKT expression per 100 cells per treatment from experiments that were repeated thrice. (C) Quantitation of NESTIN expression per 100 cells per treatment from experiments that were repeated thrice. (D) Protein lysates derived from untreated and treated primary GBM cells were probed for p-AKT, total AKT, cleaved PARP and cleaved caspase 3 against GAPDH as a control by western blotting. (E) Self-renewal of GBMs as represented by number of secondary neurosphere formation from cells treated for 5 days.

