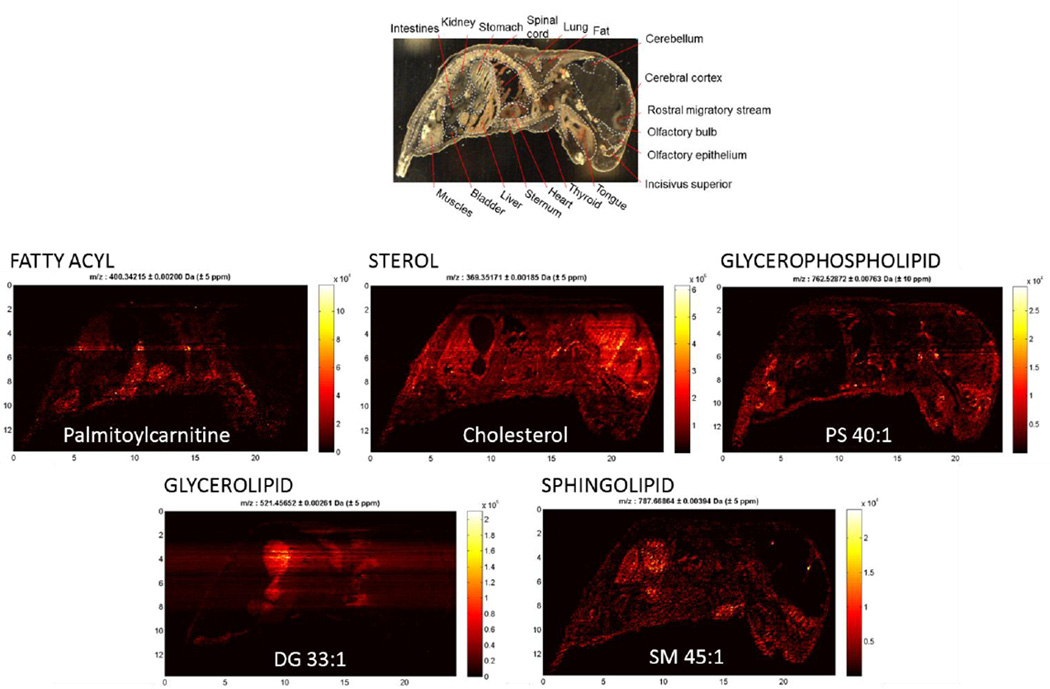
Figure 4.
Selected ion maps representing lipid classes identified by IR-MALDESI in whole body sections of neonate mouse, along with putative ion identification from Lipid Maps where available. An abbreviated mouse anatomy is included at top of the image to highlight regions where ion-specific localization of IR-MALDESI response has been observed.

