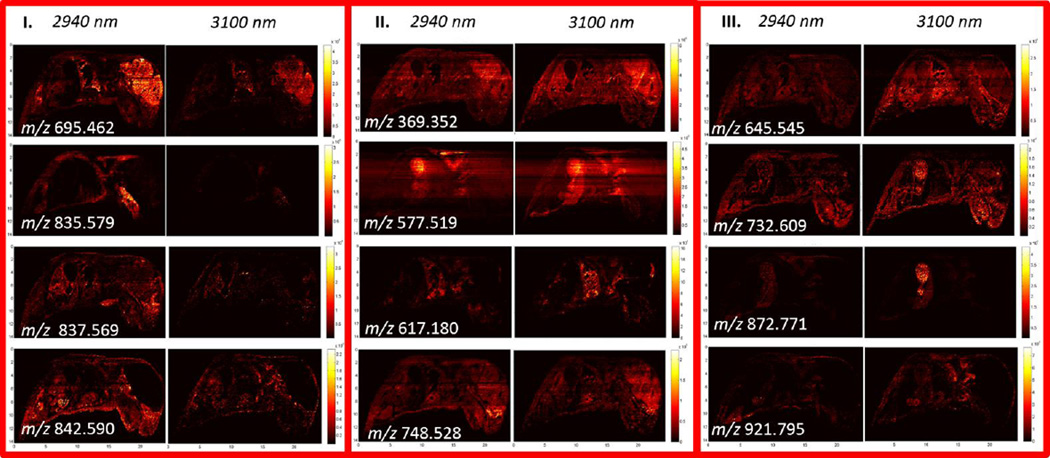
Figure 5.
Selected ion maps of serial 25 µm thick whole mouse corresponding to each of the three classes of ions defined in Figure 3. Pairs of ion maps corresponding to the matching MSI experiments are shown with matching intensity scales to illustrate differences in ion abundances between the sections imaged at λ = 2940 nm and 3100 nm.

