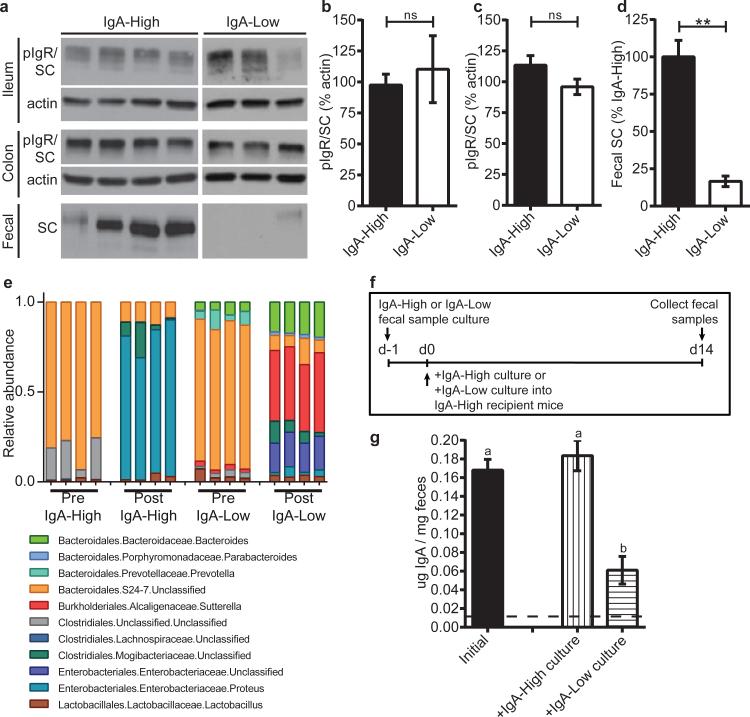
Figure 3. The IgA-Low phenotype correlates with an absence of fecal SC and the presence of specific microbial taxa in vivo, which can be anaerobically cultured in vitro.
a, Representative anti-pIgR/SC immunoblots (of n=3 replicates) of intestinal tissue/fecal samples from IgA-High/IgA-Low mice. b-d, Quantification of immunoblots for (b) ileal, (c) colonic, and (d) fecal pIgR/SC. Mann-Whitney test: (b) P=0.7424, n=7(IgA-High), n=5(IgA-Low) mice; (c) P=0.1285, n=10(IgA-High), n=15(IgA-Low) mice; (d) P=0.0025, n=7(IgA-High), n=5(IgALow) mice. e, Relative abundance of Order/Family/Genus 16S rDNA sequence assignments of culture inoculate from IgA-High/IgA-Low samples (Pre) or overnight cultures of these inoculates (Post); n=4 samples/group. Statistical analysis: Extended Data Table 2. f, Schematic of culturing/administration experiments. g, Fecal IgA measured in IgA-High mice pre-(n=18) and post-cultured microbe administration [+IgA-High culture(n=10), +IgA-Low culture(n=9)] depicted in (f). One-way ANOVA: F=18.60, P<0.0001. All values=mean±s.e.m. Different letters indicate significant differences, Tukey's multiple comparison test. Dotted lines=limit of detection.

