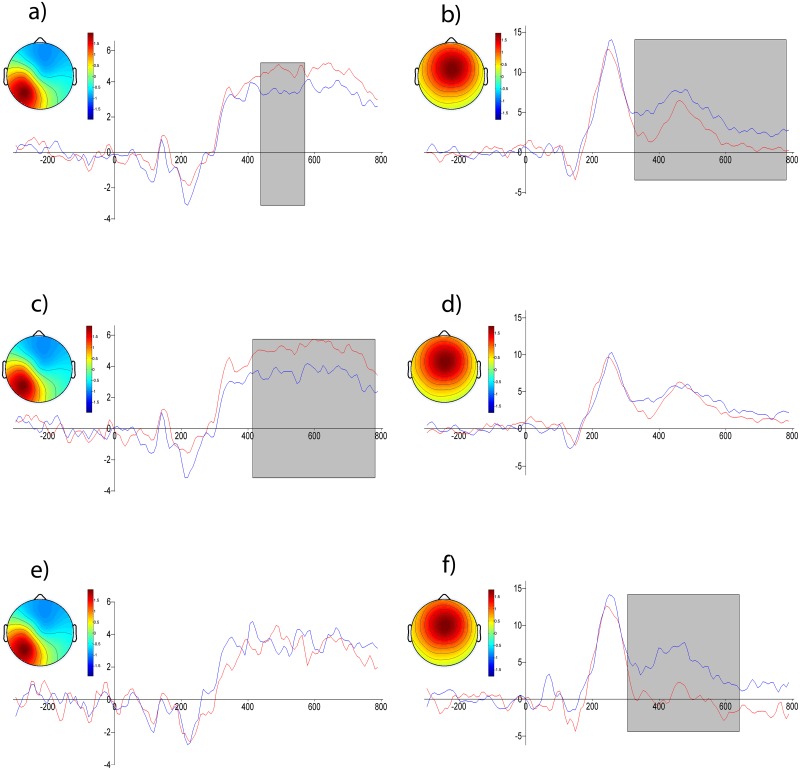
Fig 4. ICs averaged across subjects for two clusters.
a) and b) contrast of levels of origin: red line—automatic, blue line—reflective; c) and d) contrast of levels of origin for emotional words only, e) and f) for neutral words only. Horizontal axis—time in ms, vertical—amplitude in arbitrary units. Gray rectangles mark significant differences. Insets depict the cluster topography.

