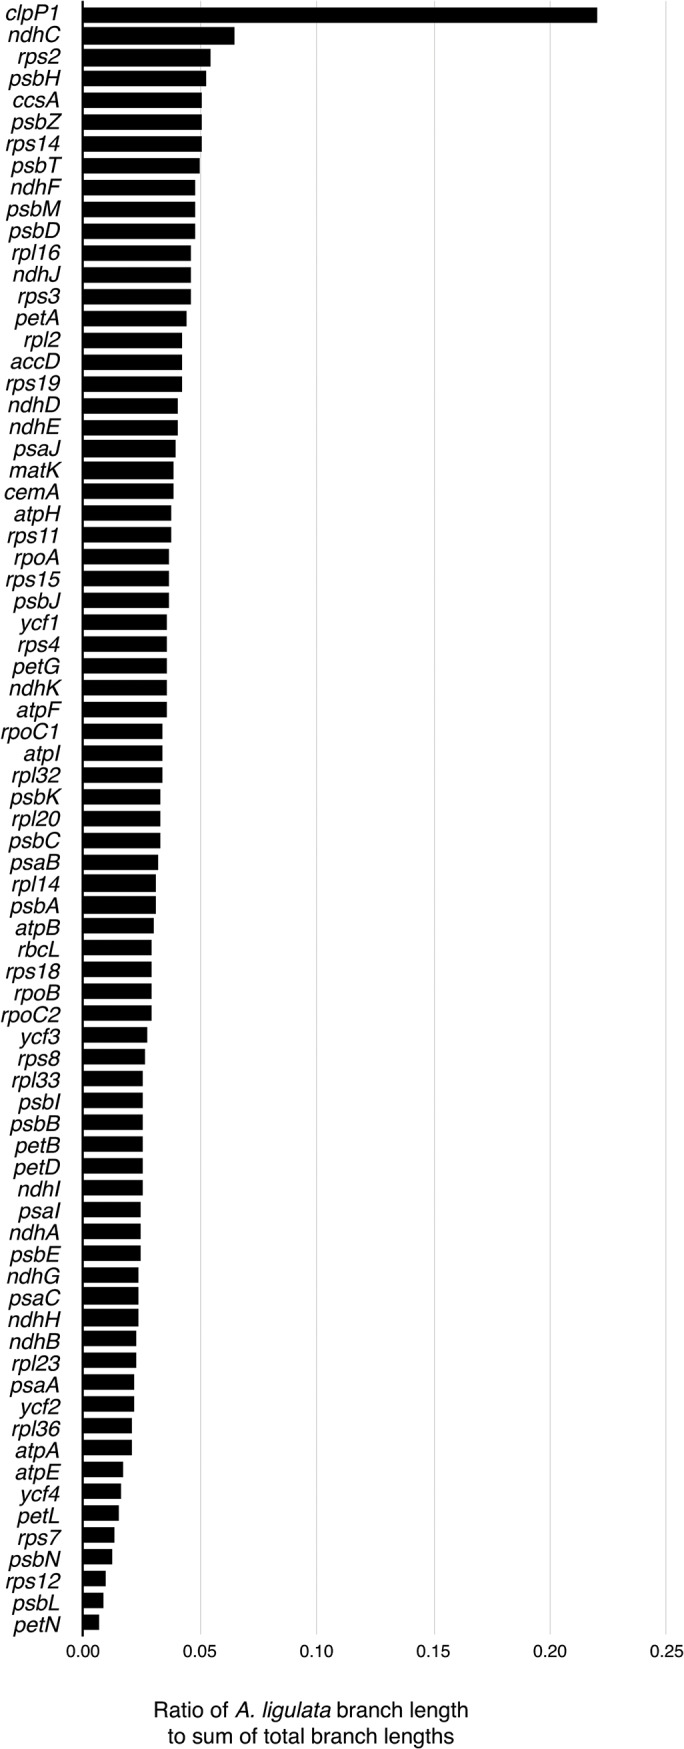
Fig 5. Relative branch lengths leading to Acacia ligulata in different gene trees.

Phylogenetic reconstructions were performed separately for each individual gene alignment using MrBayes with a General Time Reversible model with gamma and invariant sites. The bar chart indicates the proportion of the total branch length in each tree contributed by the branch leading to Acacia ligulata.
