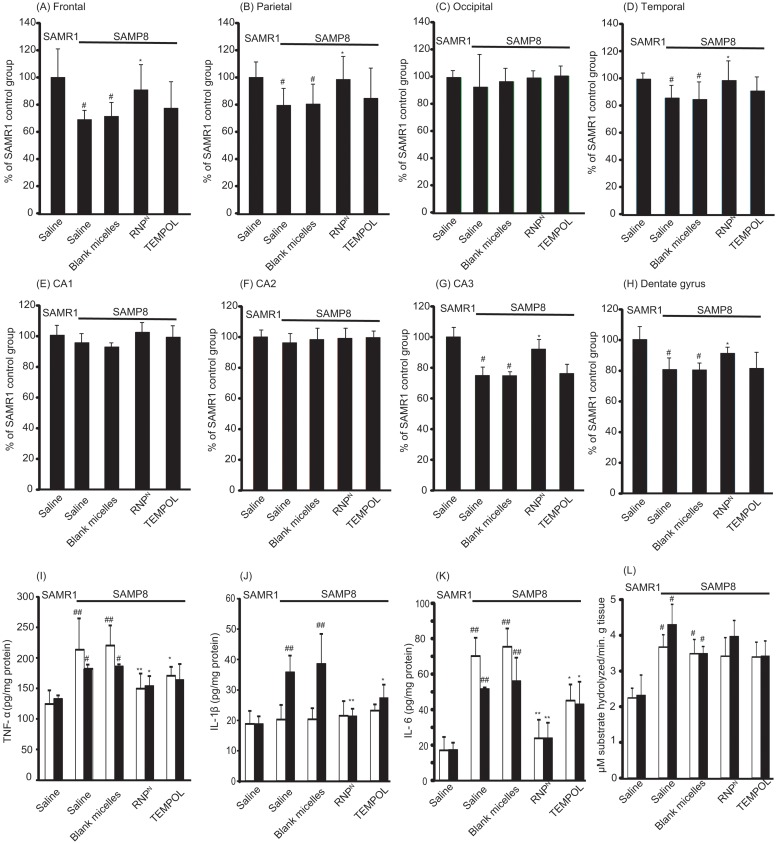
Fig 4. The density of surviving neurons in SAMP8 mice was increased by oral administration of RNPN.
The densities of surviving neurons in various subregions of (A) frontal, (B) parietal, (C) occipital, (D) temporal, (E) CA1, (F) CA2, (G) CA3, and (H) dentate gyrus in the brain of SAMP8 mice were assessed by cresyl violet staining. The values are expressed as the mean ± SEM values (n = 5). #P < 0.05, compared with SAMR1 mice. *P < 0.05, compared with SAMP8 control mice. (I-K) Levels of proinflammatory cytokines of (I) TNF-α, (J) IL-1β and (K) IL-6 in the cortex (white bar) and hippocampus (black bar) areas of the brain of SAMR1 and SAMP8 mice are shown. Values are expressed as mean ± SEM (n = 10). #P < 0.05, ##P < 0.01, compared with SAMR1 mice. *P < 0.05, compared with SAMP8 control mice. (L) Effect of redox polymer nanotherapeutics on acetylcholinesterase (AChE) activity in the SAMP8 mice brain. Values are expressed as mean ± SEM (n = 10). #P < 0.05 compared with SAMR1 mice.

