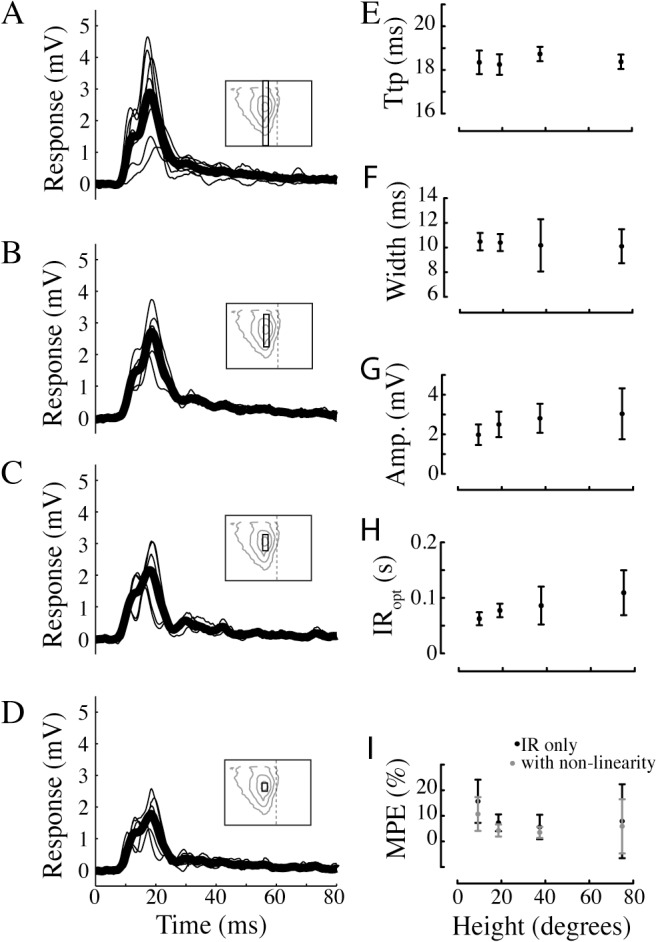
Fig 4. The impulse response to different figure sizes.

A. The impulse response to full-contrast bar moving over a grey background. The bar covered the vertical extent of the screen (75°, see inset pictogram for the bar’s height relative to the HSN receptive field as projected on the visual display). The individual impulse responses from each neuron are displayed with thin lines, and the average impulse response across neurons is displayed with the fat black line (N = 7). B. The impulse response to a 37° high bar (N = 5). C. The impulse response to a 19° high bar (N = 5). D. The impulse response to a 9° high bar (N = 5). E. Time-to-peak (Ttp) values for the data in panels A-D. F. Half-width values, i.e. the width of the impulse response at 50% maximum amplitude, for the data in panels A-D. G. Peak amplitude values, i.e. the maximum amplitude, for the data in panels A-D. H. The optimal impulse response (IRopt) length for the data in panels A-D, defined as the impulse response length that gives the minimal MPE. I. The minimum MPE for the data in panels A-D. The black data show the results using only the impulse response, and the black data the MPE after adding the static non-linearity. In panels F-I the data show mean ± sd.
