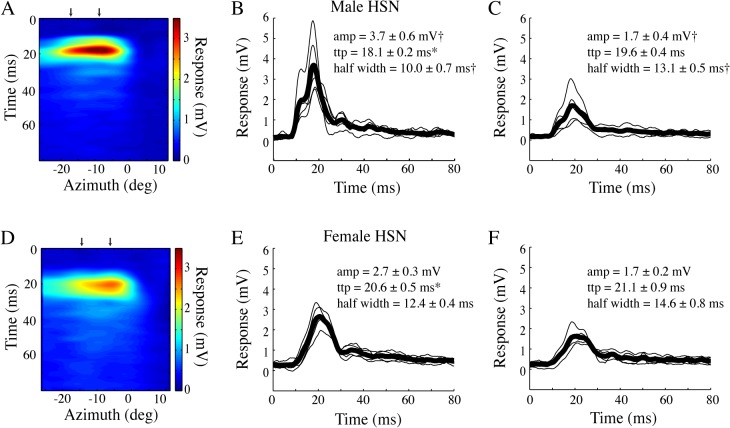
Fig 5. The spatio-temporal profile of the bar impulse response.
A. The male HSN spatio-temporal impulse response profile shows the bar’s azimuthal position on the x-axis (interpolated from 9 start positions), the temporal profile of the impulse response on the y-axis, with the response amplitude color-coded. The bar moved on a grey background. N = 5. B. The individual impulse responses from the center of the receptive field (see arrow in panel A) in thin black, and the mean in fat black line. C. The impulse responses from the peripheral receptive field (see arrow in panel A). D. The spatio-temporal profile for female HSN. N = 4. E. The individual impulse responses from the center of the female HSN receptive field in thin black, and the mean in fat black line. F. The impulse responses from the female HSN peripheral receptive field. In panels B, C, E and F stars (*) indicate significant differences between the sexes, whereas crosses (†) indicate significant difference between stimulus locations (central or peripheral receptive field). Significance (p<0.05) was tested with one-way ANOVA followed by Bonferroni's multiple comparison tests.

