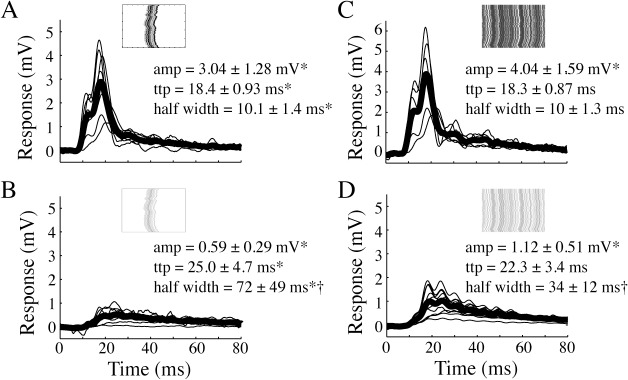
Fig 6. The impulse response to low contrast stimuli is slower.

A. The impulse response to a full contrast vertical bar (male HSN, N = 8). B. The impulse response to a 10% contrast bar (male HSN, N = 11). C. The impulse response to a full contrast, full screen background pattern (male HSN, N = 7). D. The impulse response to a 10% contrast, full screen background pattern (male HSN, N = 12). In all panels the pictograms display example space-time plots. Stars (*) indicate significant differences between contrast conditions, and crosses (†) indicate significant differences between stimulus types (bar or background). Significance (p<0.05) was tested with one-way ANOVA followed by Bonferroni's multiple comparison tests.
