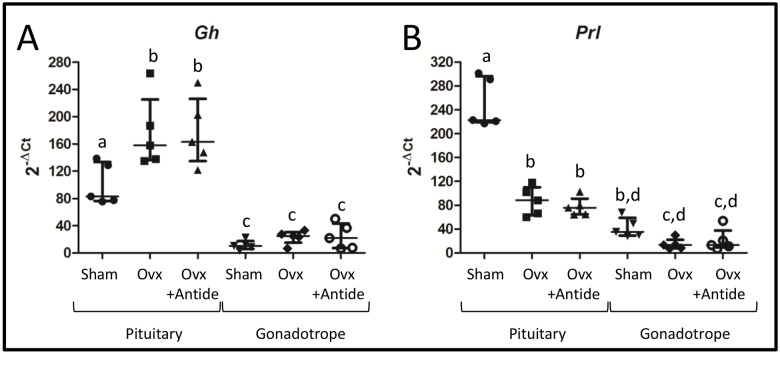
Fig 3. Gh and Prl mRNAs lack enrichment in HA-tagged polyribosomes.
Real-time PCR was performed on total RNA or HA-tagged polyribosomes with primers specific to A.) Gh and B.) Prl. Values were plotted with the median and interquartile range values indicated for both total pituitary and HA-tagged polyribosomes. Statistical differences (n = 5) were determined by a one-way ANOVA followed by a Tukey’s multiple comparison test. Groups identified with different letters indicate significantly different groups. Each “n” represents 5–7 pooled pituitaries per treatment group.

