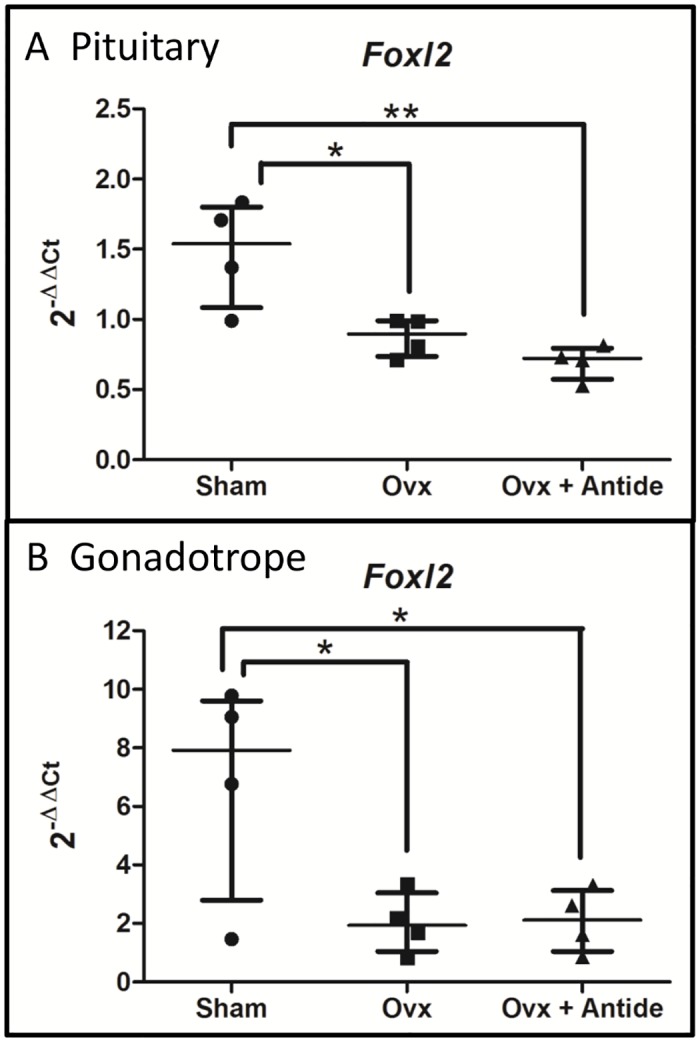
Fig 6. Foxl2 levels in gonadotropes are dependent on the ovary.

2-ΔΔCt values were calculated using total RNA from LβT2 cells as the calibrator. The median with interquartile range is shown for A.) total pituitary Foxl2 levels and B.) gonadotrope Foxl2 levels. Statistical differences were determined by a one-way ANOVA followed by Tukey’s multiple comparison test (*<0.05; **<0.01). N = 4, where each “n” represents 5–7 pooled pituitaries per treatment group.
