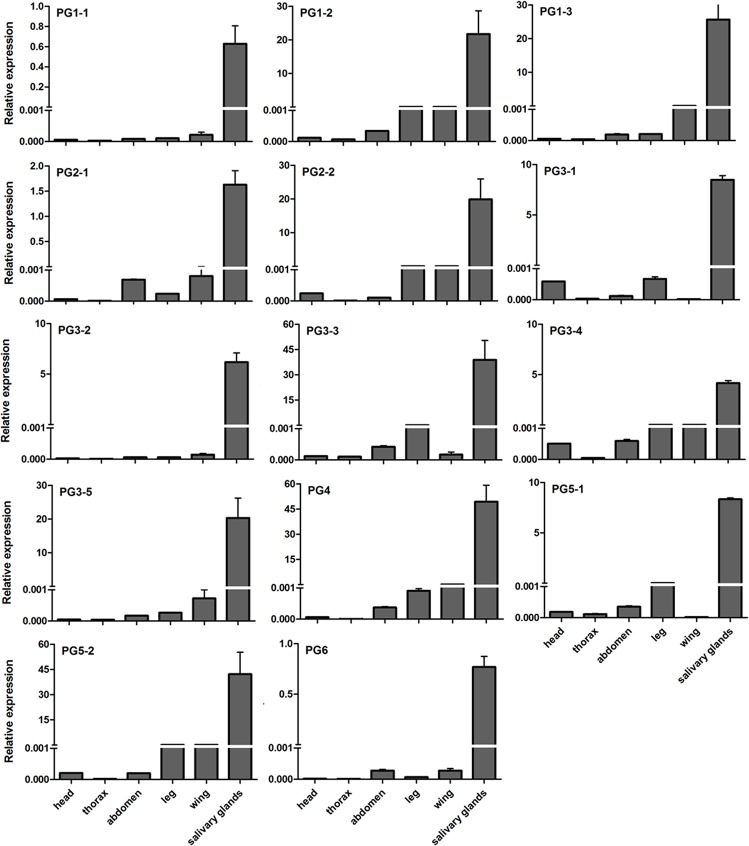
Fig 2. Relative expression level of PG transcripts in different tissues from Apolygus lucorum adults using β-actin and GAPDH as reference genes.
The values on the Y-axis indicate the expression level of PG genes relative to β-actin and GAPDH genes, which is set to 1. Mean ± SE. The expression level of each PG was significantly higher in salivary glands than in other tissues (P<0.05).

