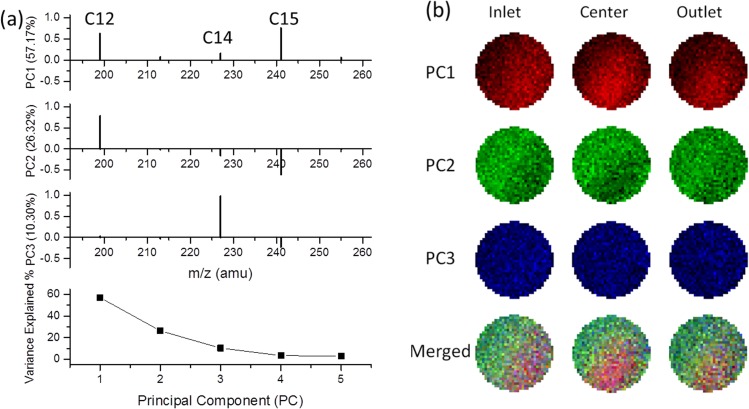
FIG. 2.
(a) Image PCA loading plots illustrating the contribution of each FA peak in the day 6 biofilm at three locations within the microfluidic channel. The variance contributions of each PC are shown at the bottom. (b) Reconstructed false-color 2D PCA images in RGB corresponding to each PC scores at these locations along the microfluidic channel. The RGB composite images of the three key PCs are depicted in the bottom. Only data within the 2 μm diameter circle were considered in analysis.

