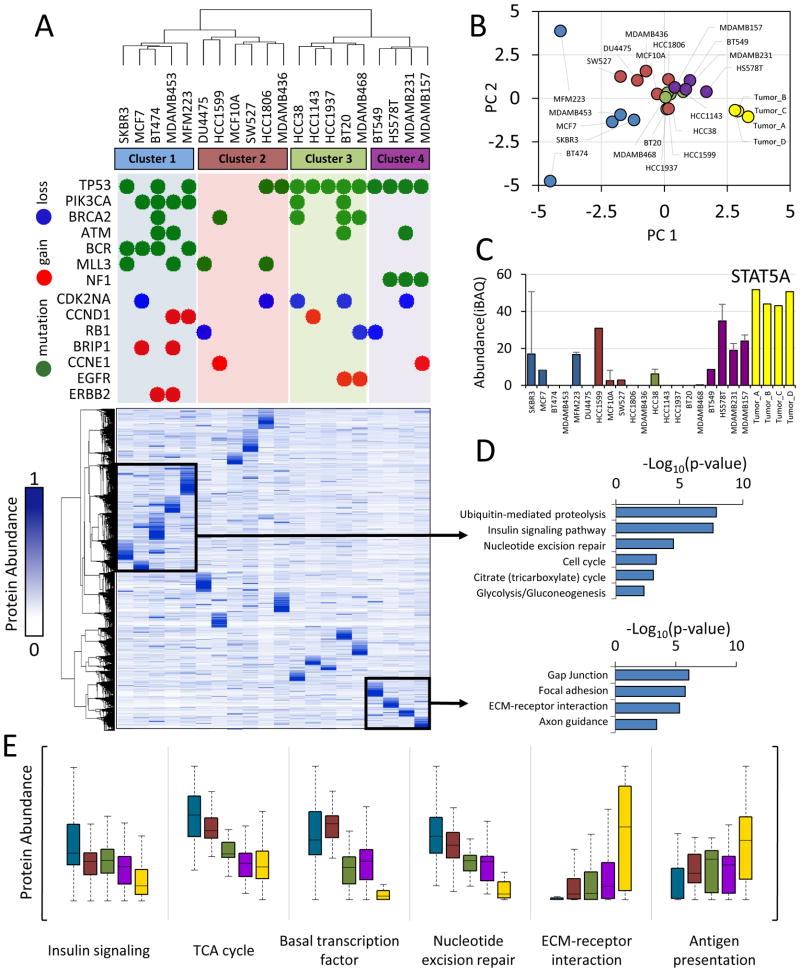
Figure 3. The triple-negative breast cancer proteome.
(A) Hierarchical clustering of protein expression profiles computed using centered Pearson’s correlation identified four proteome subtypes as indicated. Protein expression values were normalized to a scale from 0 to 1 prior to clustering. Frequent genetic aberrations are overlaid onto the proteome clustering results. Green circles represent exonic mutations. Red and blue circles represent copy number gain (>7 copies) or loss (0 copies), respectively. Colored background shading corresponds to cluster membership. At the time of writing, exome sequence and copy number data were not available for MCF10A, SW527. (B) Scatter plot of principal component 1 and 2. Principal component analysis was performed using protein expression profiles. Each point represents a sample. Colors represent hierarchical cluster membership from (A). (C) Biological pathways enriched from the indicated proteins clusters. Inverted log10 p-values are shown. (D) Representative example of a protein upregulated in cluster 4 and tumors. STAT5A: signal transducer and activator of transcription 5A. Error bars represent S.D. (E) Distribution of protein abundances within each cluster (colors) for indicated biological processes. For all panels, cluster membership is indicated by the same colors used in (A), with tumor samples indicated in yellow.

