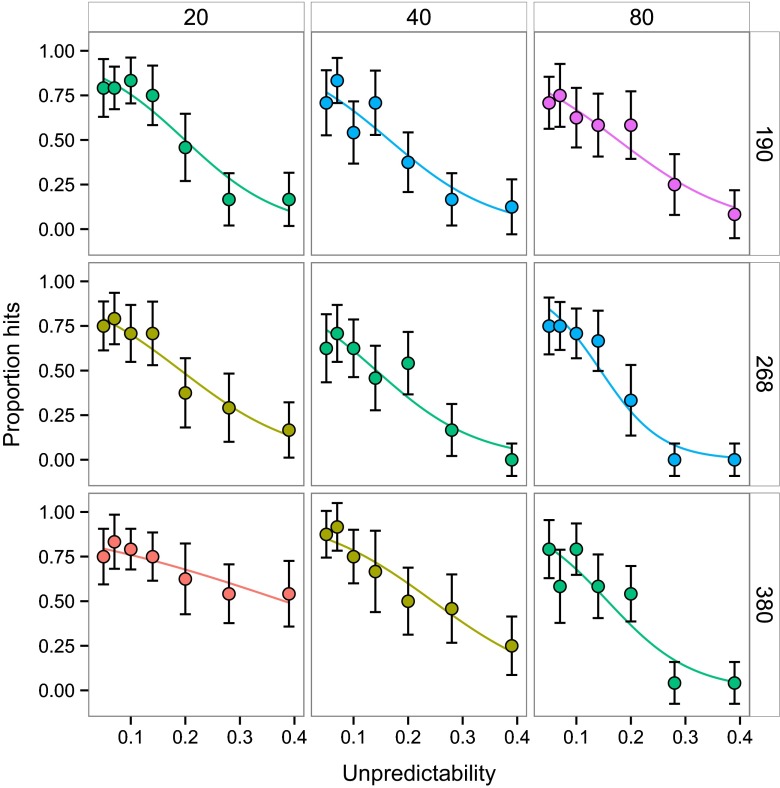
Fig. 2.
Proportion of trials where the target was successfully tracked, plotted against unpredictability of object motion. The nine panels represent the factorial combination of number of objects (20, 40, 80) and display area (190, 268, 380). The error bars are 95 % confidence intervals, with the between-subject variation removed (appropriate for a repeated-measures design). The smooth curves are logistic regressions. Colour codes density: panels sharing the same colour are the same density. The same colour code is used in Fig. 3

