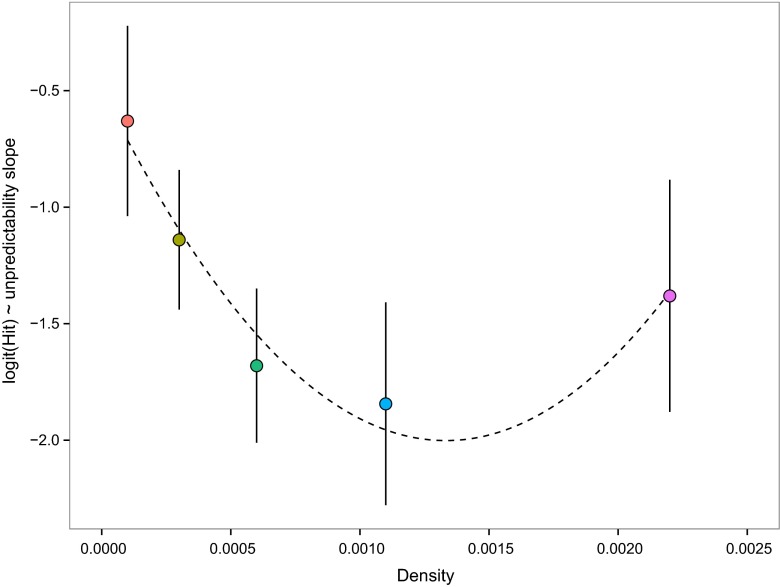
Fig. 3.
The slope (with 95 % c.i.s) of the relationship between proportion of targets successfully tracked and the unpredictability of target motion, plotted against object density. The slopes are based on logistic regressions, as in Fig. 2. The deleterious effect of unpredictability on target tracking (the magnitude of the negative slope) increases with object density, then declines at the highest density, as indicated by the plotted quadratic curve. The colours of the points correspond to those used in Fig. 2

