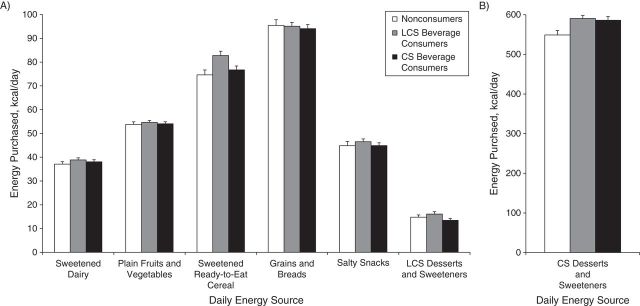
Figure 2.

Mean energy (kcal/day) from selected food groups (A) and caloric-sweetened desserts and sweeteners (B) by each beverage-consumer profile, Homescan survey, 2000–2010. Results are presented as means with standard error bars obtained from a generalized method of moments 2-step system dynamic panel model. In the first step, average number of household grocery trips per year and percentages of market sales made up of beverages sweetened with low-calorie sweeteners (LCS beverages) and beverages sweetened with caloric sweeteners (CS) (specified for the level equation and differenced equation) as the lagged instrumental variables. In the second step, we used the second and third lags of LCS and CS beverage purchases (specified for the differenced equation). There were 41 instrumental variables in total. The models were adjusted for age, sex, educational level, race/ethnicity, income, and year of data collection. Using margins commands in the fully adjusted models, we predicted the mean of the outcome for consumers of LCS beverages, consumers of CS beverages, and persons who did not consume sweetened beverages (nonconsumers). LCS beverage consumers were persons who purchased 1 serving/day of LCS beverages but 0 servings/day of CS beverages; the opposite was true for CS beverage consumers. LCS beverage consumers had total daily purchases of energy from sweetened ready-to-eat cereals that were significantly different from those of nonconsumers and CS beverage consumers (P < 0.05). Nonconsumers had total daily energy purchases from CS desserts and sweeteners that were significantly different from those of LCS and CS beverage consumers (P < 0.05).
