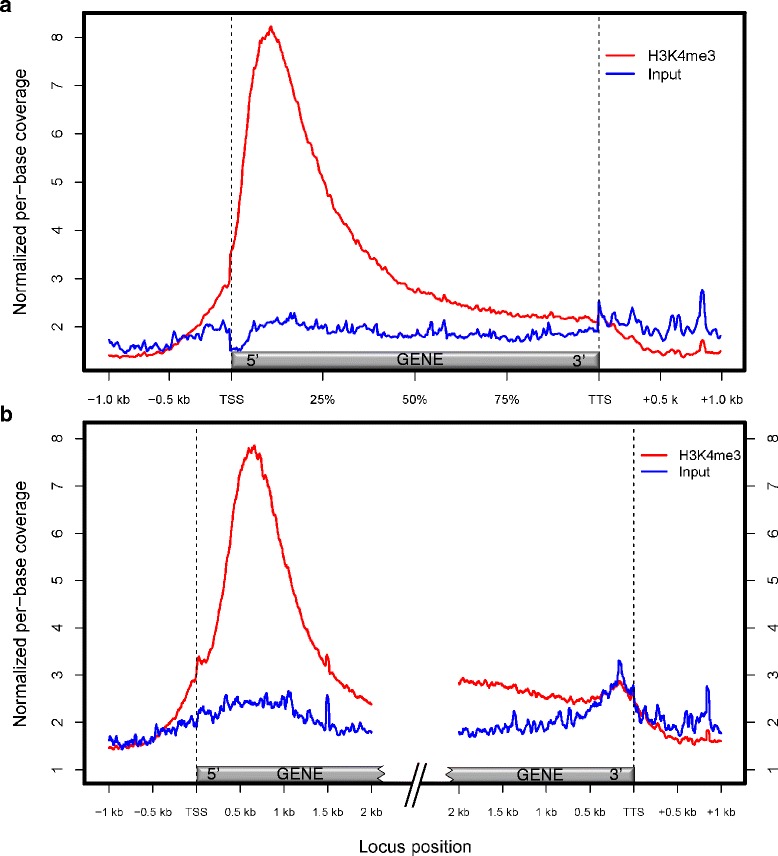
Figure 2.

H3K4me3 and Input ChIP-seq profiles across the 1 kb promoter, transcribed and 1 kb downstream regions of annotated loci. (a) Bin-wise, showing relative gene length. (b) Absolute distance anchored at the 5’ and 3’ ends of transcribed regions. The 5’ and 3’ regions were analysed separately, thus profiles overlap for genes < 4 kb. Per-base coverage values were normalized between H3K4me3 and Input libraries. TSS, transcription start site; TTS, transcription termination site; gene, regions annotated as transcribed in E. grandis v.1.1.
