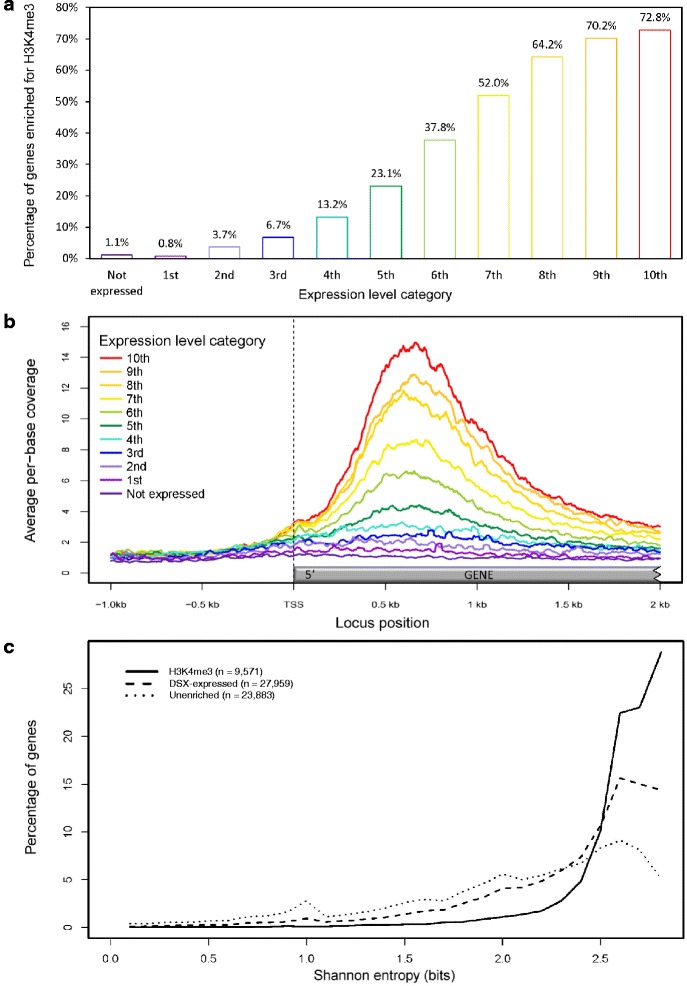
Figure 3.

Expression properties associated with H3K4me3 enrichment in developing secondary xylem tissue. (a) Percentage of genes enriched for H3K4me3 among non-expressed genes and genes with increasing expression levels, represented as ten ordinal categories of similar size (n ≈ 2,760). (b) H3K4me3 enrichment (library coverage) at the 5’ regions of transcribed genes, for each of the expression level categories in (a). Average per-base coverage values from 1 kb upstream to 2 kb downstream of the transcriptional start site (TSS) is shown for each expression level category. (c) Tissue specificity of genes enriched for H3K4me3 (solid line), genes expressed in developing secondary xylem regardless of histone modification status (dashed), and genes expressed in developing secondary xylem but lacking H3K4me3 modification (dotted), as measured by Shannon entropy. High entropy values indicate broad, even expression across tissues; low values indicate high tissue specificity. The maximum possible entropy value for this data is 2.81.
