
Fig. 3.
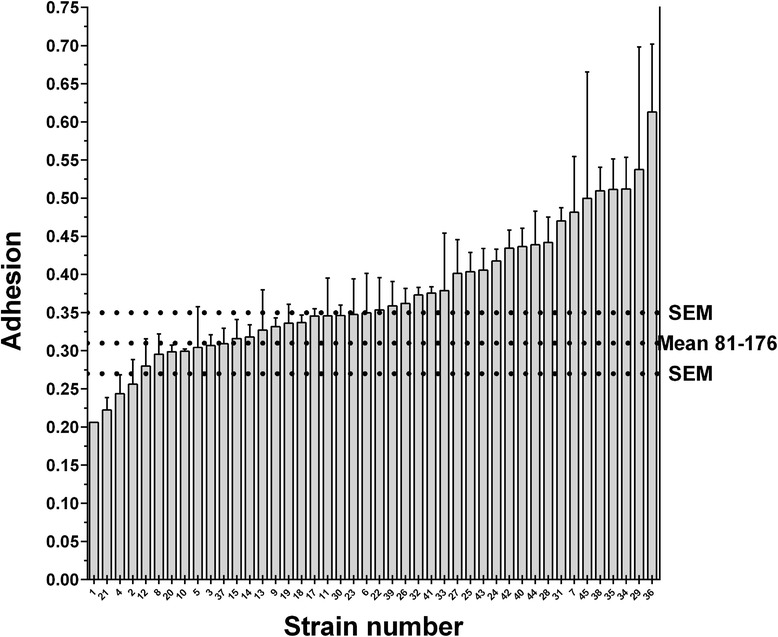
Adhesion to primary caecal chicken cells by the Campylobacter jejuni chicken strains. The error bars represent the SEM. The horizontal dashed lines represent the control strain 81–176 and its SEM. Strain results were classified by increasing order. The x axis represents the strains numbered according to their final mean rank value, presented in Table 1. Strains were found with different adhesion properties (Kruskal-Wallis, p < 0.0001). Adhesion is expressed as −1/log (adhered bacteria/initial bacteria used)