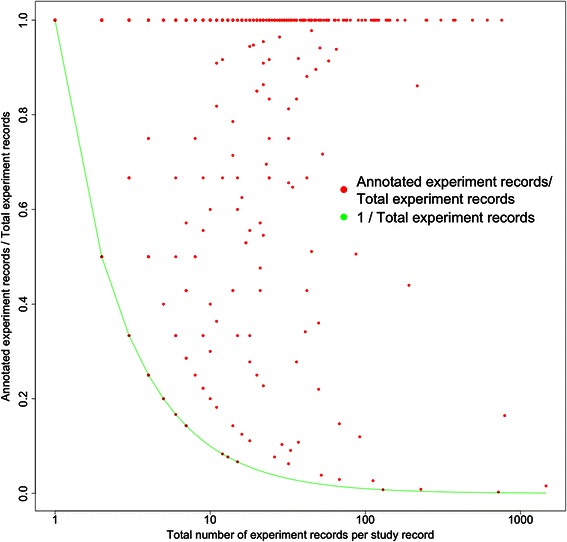
Figure 3.

Ratio of annotated experiment records to total vs total number of experiment records per study. Only study records where at least one experiment record is fully annotated are included. Points where the ratio is 1 represent study records where all of the experiment records in a given study are fully annotated. The green line is a plot of 1/total number of experiment records in a given study. Points lying along this line are those studies where only one experiment record is fully annotated (presumably to represent the annotation of all the other experiment records). Points between these two curves represent studies where an intermediate number (neither 1 or all of the experiment records) are annotated.
