
Figure 1.
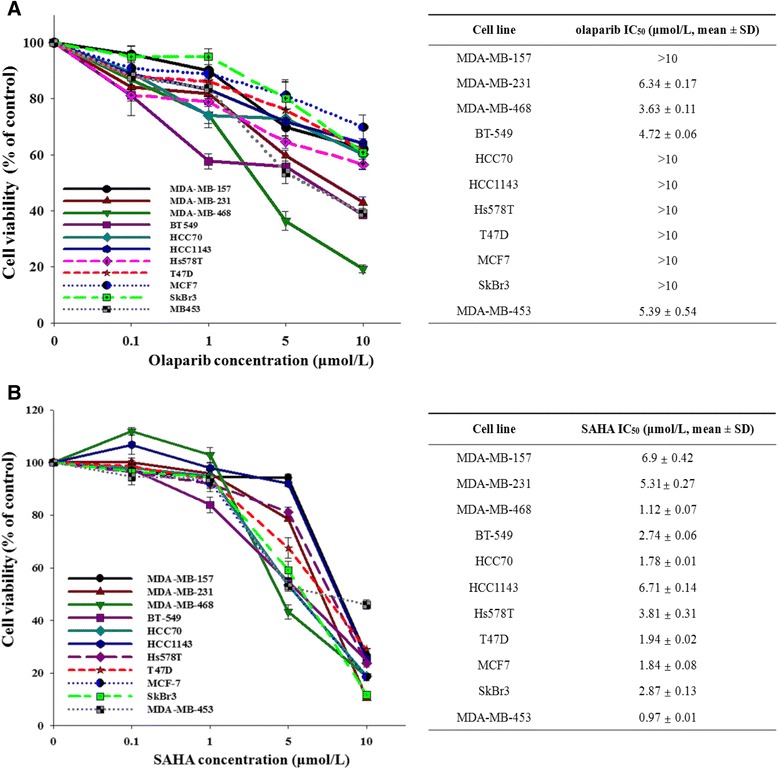
Breast cancer cell lines show a heterogeneous response to olaparib and SAHA. The growth inhibitory effects of olaparib and suberoylanilide hydroxamic acid (SAHA) were measured with an MTT assay. The cells were treated with increasing doses of olaparib (A) and SAHA (B) for 5 d. The percentage of surviving cells is presented in a graph with SD bars (n = 3; right). IC50 values were calculated using SigmaPlot and are shown in the table (left).