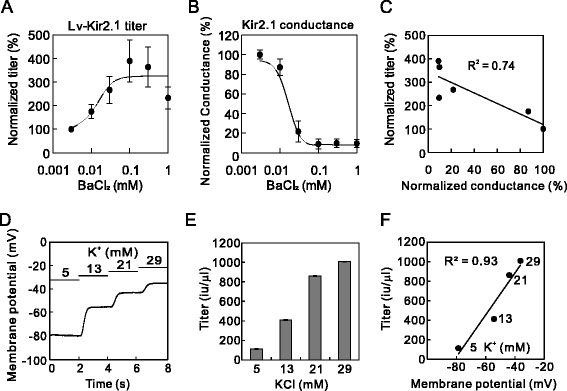
Figure 4.

Correlation between Lv-Kir2.1 titer and Kir2.1 current. (A) Ba2+ concentration–Lv-Kir2.1 titer relationship (n = 4). (B) Ba2+ concentration–Kir2.1 conductance relationship (n = 4). These relationships were fitted to the Hill equation (four parameters). (C) Correlation between Kir2.1 conductance and lentiviral titers at various concentrations of BaCl2. Values were normalized to that of 0.003 mM BaCl2 and were fitted by linear regression (R 2 = 0.74). (D) Changes in the membrane potential at higher extracellular K+ concentrations. Tyrode’s solution, in which the K+ concentration was varied, was perfused sequentially. (E) Extracellular-K+-concentration-dependent increase in the titer of Lv-Kir2.1. Lentiviral vectors were prepared with medium containing 5, 13, 21, or 29 mM KCl. We determined the lentiviral titers and found significant differences at different extracellular K+-concentrations (p < 0.0000000001, analysis of variance [ANOVA], n = 4). (F) Correlation between membrane potential and the Lv-Kir2.1 titer at various extracellular K+ concentrations. Values are the means of four experiments and were fitted with linear regression (R 2 = 0.93).
