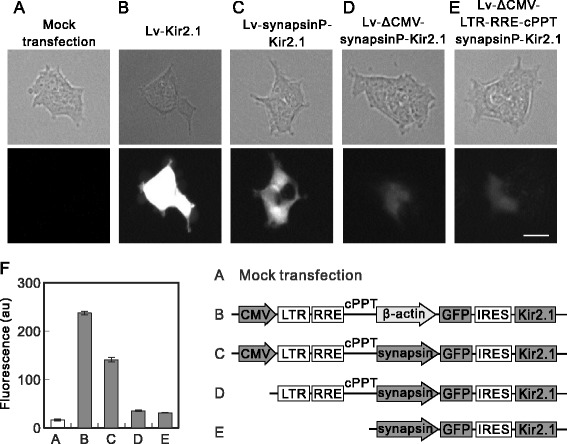
Figure 7.

GFP expression from plasmids containing synapsin promoter. (A, B, C, D, and E) Expression of GFP with synapsin promoter plasmids. 293T cells were transfected with no plasmid (A), Lv-Kir2.1 (B), Lv-synapsinP-Kir2.1 (C), Lv-ΔCMV-synapsinP-Kir2.1 (D), or Lv-ΔCMV-LTR-RRE-cPPT-synapsinP-Kir2.1 (E). Images were taken after 24 h under a microscope (IX70 Olympus). Bar, 50 μm. (F) Summary of GFP expression analyzed with the ImageJ software. The whole-cell area of each cell was manually selected, and the average gray value (n = 50, from three independent experiments) is presented as the fluorescence in arbitrary units (au) of the software (p < 0.000000001, ANOVA). Note the moderate GFP expression in the Lv-synapsinP-Kir2.1-transfected cells (p < 0.005 vs mock transfection; post hoc Student’s t test) and its slight expression in the Lv-ΔCMV-synapsinP-Kir2.1- (p < 0.01) and Lv-ΔCMV-LTR-RRE-cPPT-synapsinP-Kir2.1-transfected cells (p < 0.05). The GFP expression in the two ΔCMV-plasmids-transfected cells was lower than that in the Lv-synapsinP-Kir2.1-transfected cells (p < 0.005). Schematic illustrations show the difference in plasmid construction.
