
Figure 4.
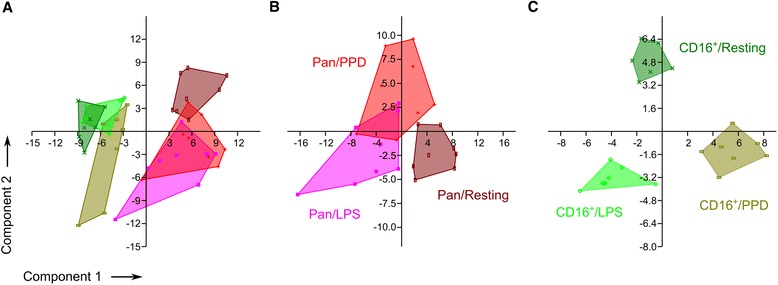
Quantitative whole-cell MALDI-TOF MS discriminates resting and stimulated human monocyte subpopulations. Principal component analysis of all samples combined (A); stimulated and resting pan-monocytes (n = 8) (B) and CD16+ monocytes (n = 7) (C), respectively, based on the peak intensity matrix.