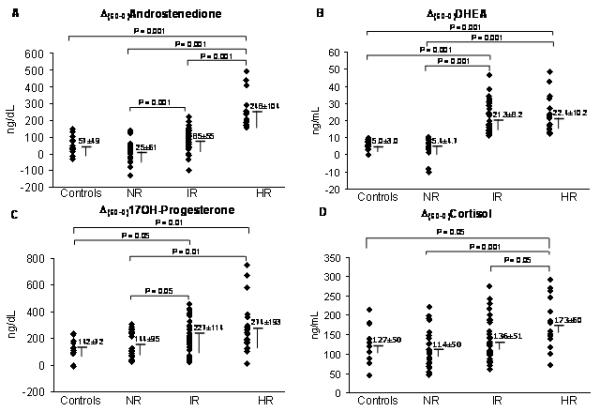
Figure 1.

Response of androgens and cortisol to ACTH1-24 (Δ(60-0)) in PCOS normal responders-NR, intermediate responders-IR and high responders-HR, and in controls shown as individual values (scatter plot) and means ± SD.
P< 0.001 for comparison in androstenedione and DHEA, P= 0.025 for comparison in 17OH-Progesterone, and P= 0.001 for comparison in cortisol among the three groups of PCOS (NR, IR, HR) by one-way ANOVA.
To convert to SI units, multiply DHEA by 3.467 (result in nmol/L) and cortisol by 27.59 (result in nmol/L).
