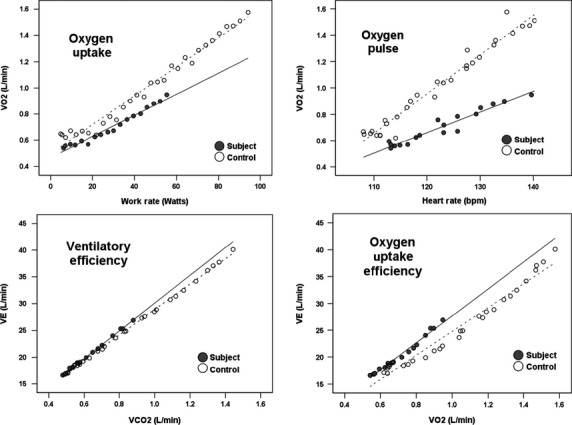
Figure 1.

Differences in slopes for ΔVO2/ΔWR (upper left), ΔVO2/ΔHR (upper right), ΔVE/ΔVCO2 (lower left) and ΔVE/ΔVO2 (lower right) calculated from 10-sec averaged data from the first 3 and 5 min for subjects with SCA and controls without SCA, respectively. Cutoff values for data points were based on the minimal test time that allowed for inclusion of the same number of data points for all subjects and controls.
