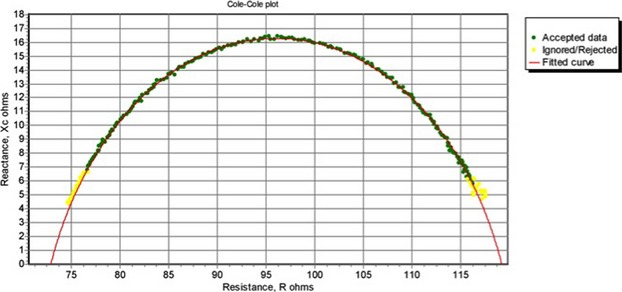
Figure 2.

A typical Cole–Cole plot of the mfBIA data obtained for Human #1 in a relaxed state. Note the thick and slightly irregular part of the curve where the measured mfBIA data closely fit to the thinner predicted curve. The fc value is the frequency at which the maximal Xc (peak of curve) is measurable.
