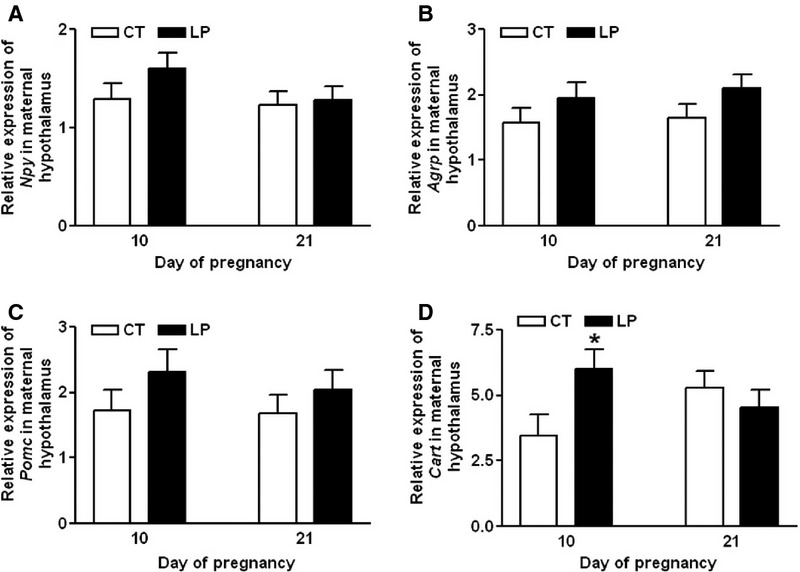
Figure 4.

Quantitative real-time PCR analysis of Npy (A), Agrp (B), Pomc (C), and Cart (D) in the hypothalamus on Days 10 and 21 of gestation. CT: control; LP, low-protein diet. The bar represents the mean ± SEM expressed as relative units of mRNA standardized against Actb (n = 8–10). *P < 0.05.
