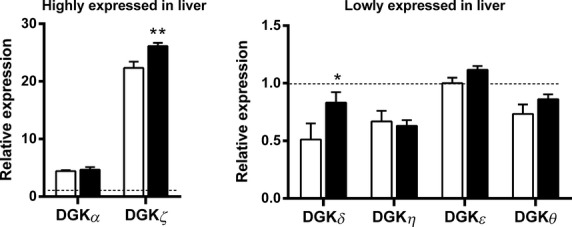
Figure 3.

mRNA expression of DGK isoforms in liver from C57BL/6J mice (white bars) and ob/ob mice (black bars). Highly expressed (left panel) and lowly expressed (right panel) DGK isoforms in liver. Data are normalized to reference genes (see Material and Methods) and presented relative to DGKε mRNA in tissues from C57BL/6J mice. Results are mean ± SEM. n = 8–10. *P < 0.05, **P < 0.01.
